Organize your data the way you want it on TradesViz.
Don't confuse flexibility with complexity :)
Spend a little extra time to permanently expand your horizons and learn a little every day 🆙
With TradesViz's tools, this is possible.
Check the new AI trade chat this weekend!
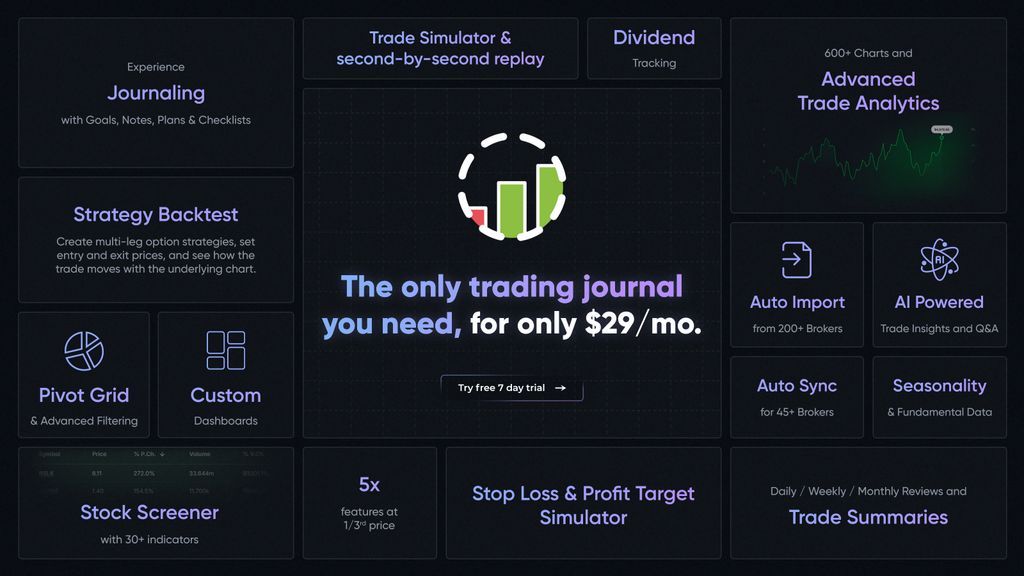
TradesViz brings every part of the trading process under one roof — structured, data‑driven, and built for clarity 📊
From advanced analytics and strategy backtesting to journaling, AI insights, and flow tracking, every feature is designed to help you see the tape clearly and act with conviction.
Auto imports, dashboards, and simulators make analysis faster, sharper, and more consistent.
It’s the all‑in‑one trading journal built for professionals — clarity, structure, and performance, all in one place 📈
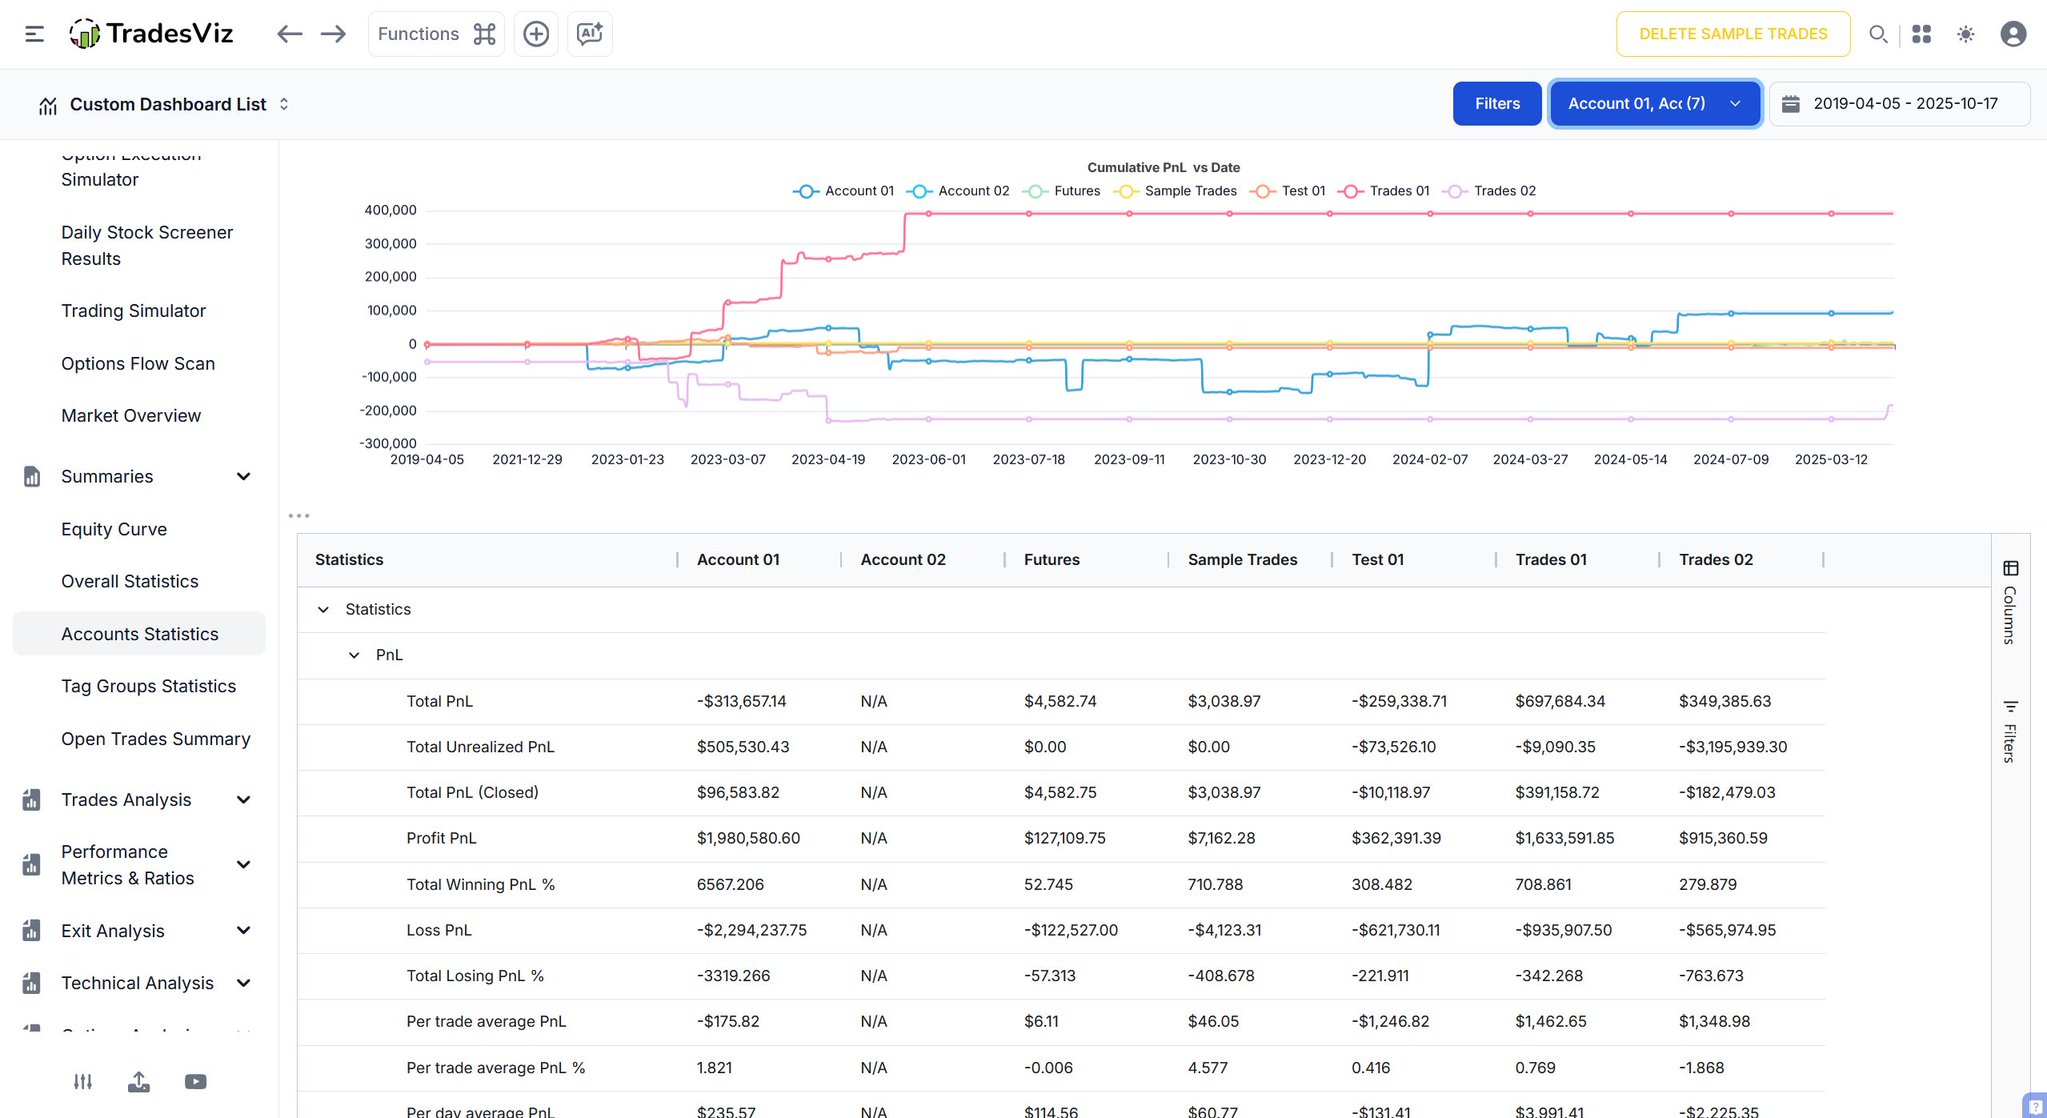
The *Accounts Statistics* dashboard in TradesViz brings every account’s performance into a unified, structured view.
Cumulative PnL lines show how each account’s conviction evolved — when the tape lit up with gains, and where positioning pulled back.
Detailed stats below break down realized and unrealized PnL, win ratios, and efficiency across portfolios.
It’s a clear, objective snapshot of account‑level performance, keeping capital distribution and long‑term consistency firmly on the radar 📈
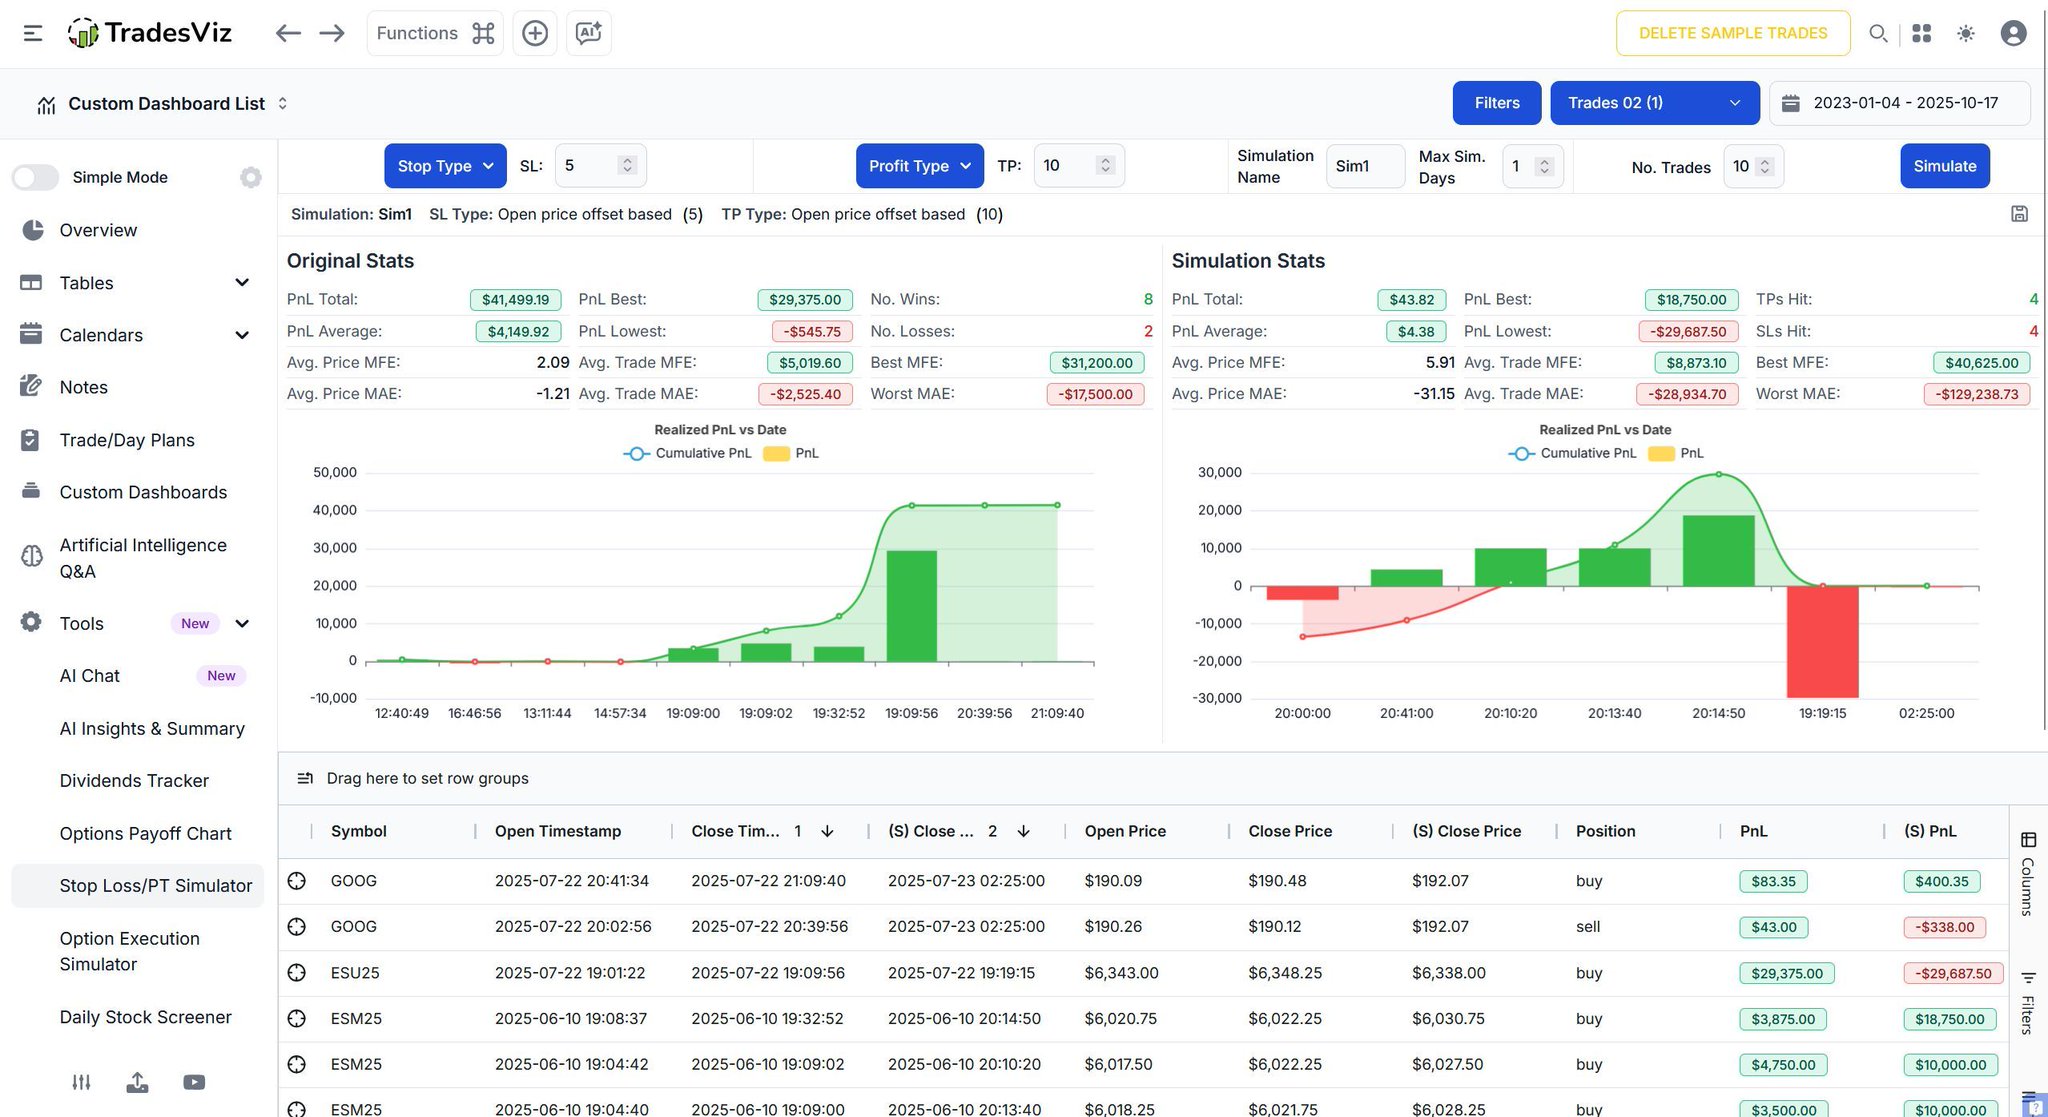
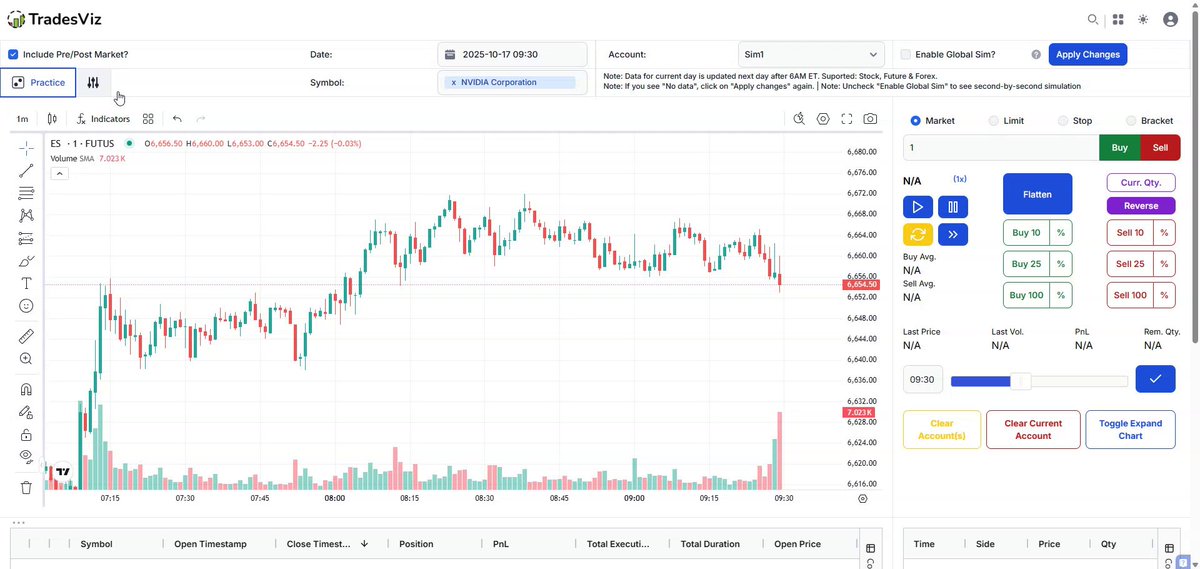
The Stop Loss / Profit Target Simulator in TradesViz gives traders a clean, data‑driven way to test trade management choices before committing capital 📊
By adjusting stop and target levels, you can see how total PnL, drawdowns, and hit ratios shift side by side.
Each simulation maps where conviction would have paid off and where tighter positioning could have preserved gains ⚙️
It’s practical, visual risk tuning — a simple tool that turns performance assumptions into measurable insight, keeping precision and control clearly on the radar 📈
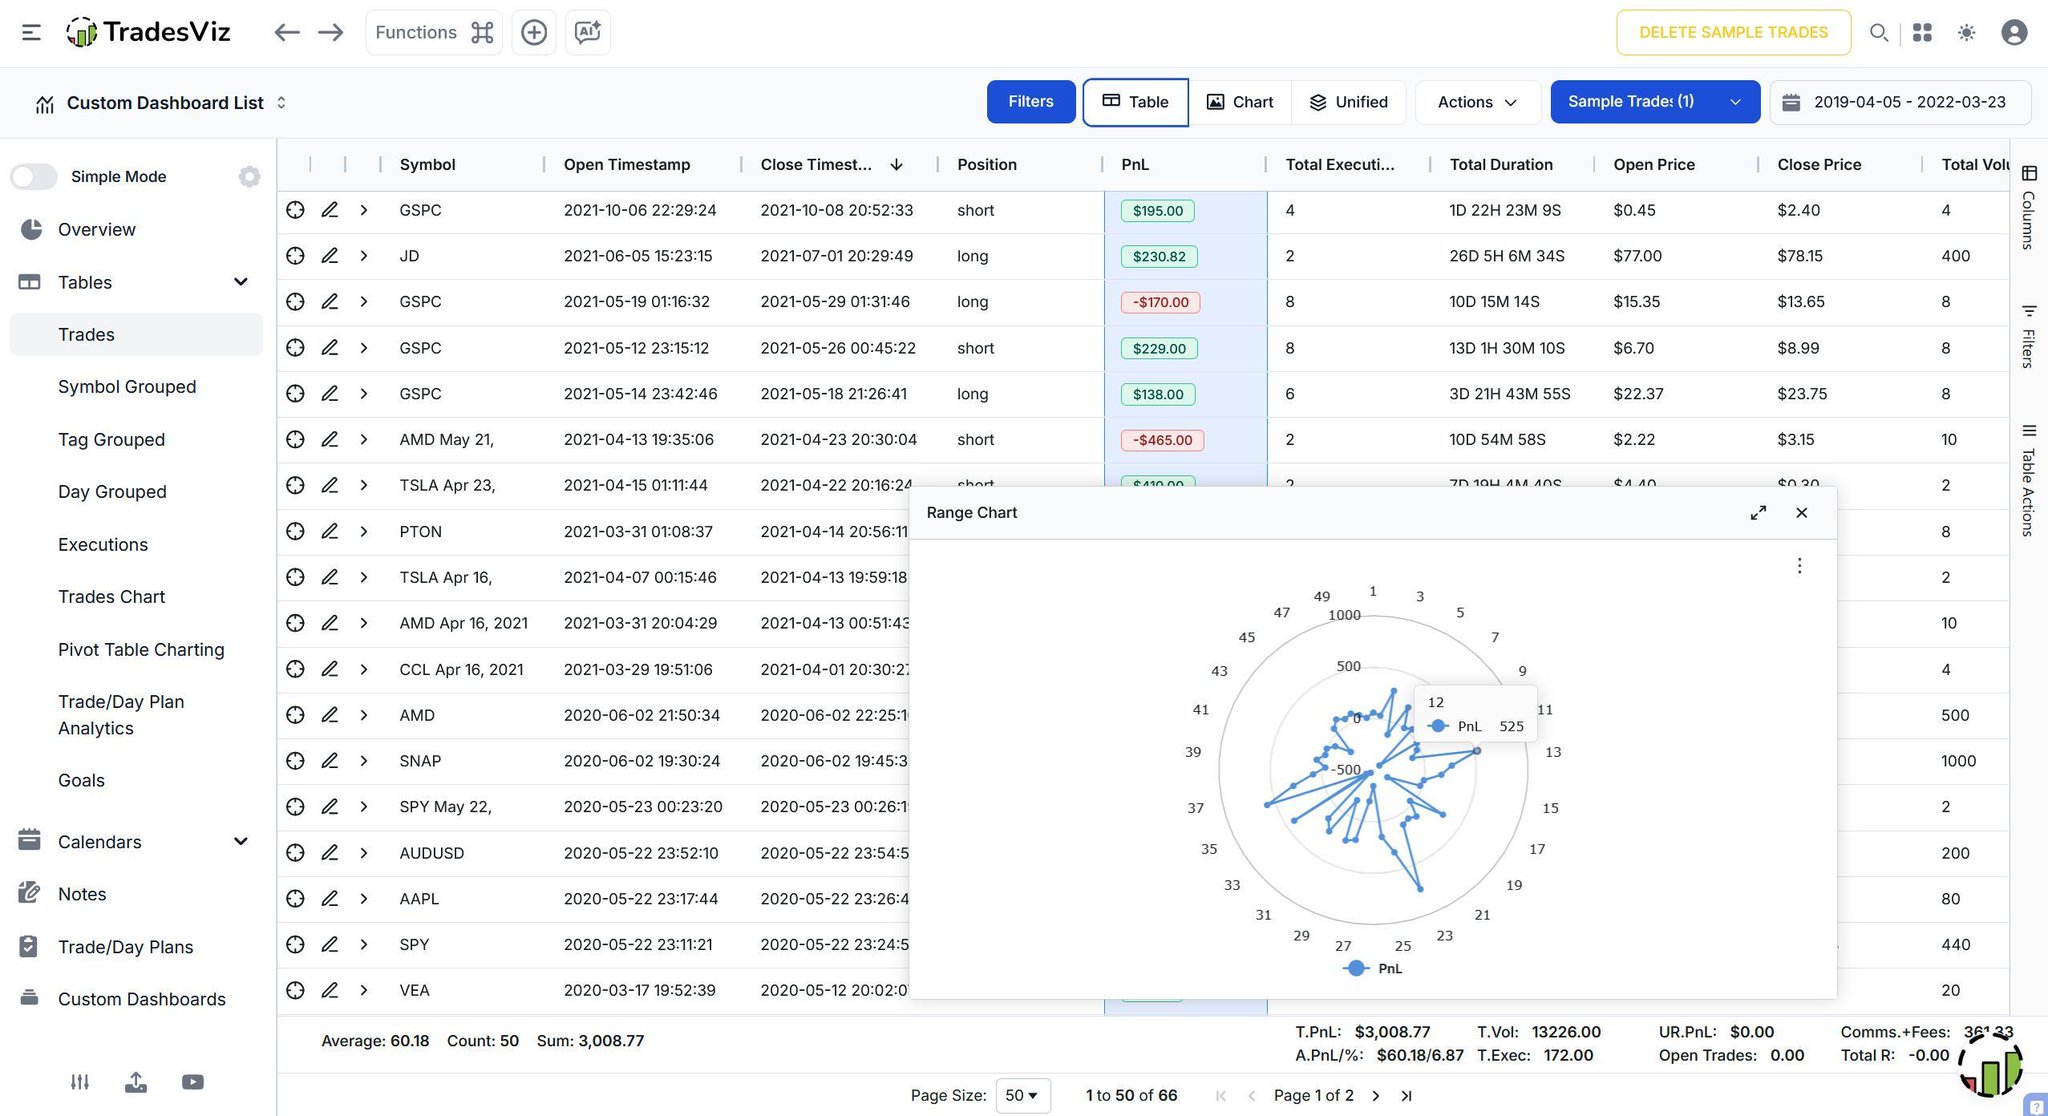
The new *Charts* in TradesViz bring a sharper, more intuitive lens to trade analysis 📊
From detailed tables to dynamic visuals like the *Range Chart*, each view connects PnL, duration, and symbol activity in one interactive layout.
It’s easy to spot where conviction piled in, when positioning shifted, and how consistency evolved over time ⚙️
Simple to use yet deeply informative — a cleaner way to study your trades and keep performance clarity always on the radar 📈
2/3 ✅ in today's practice on TradesViz simulator, we learn a lesson from $UBER... 🙂
🎲 This is the practice mode - 3 symbols practice in 90 secs - just open trades. Do you use ORB strategy?
Test yourself 👇😎
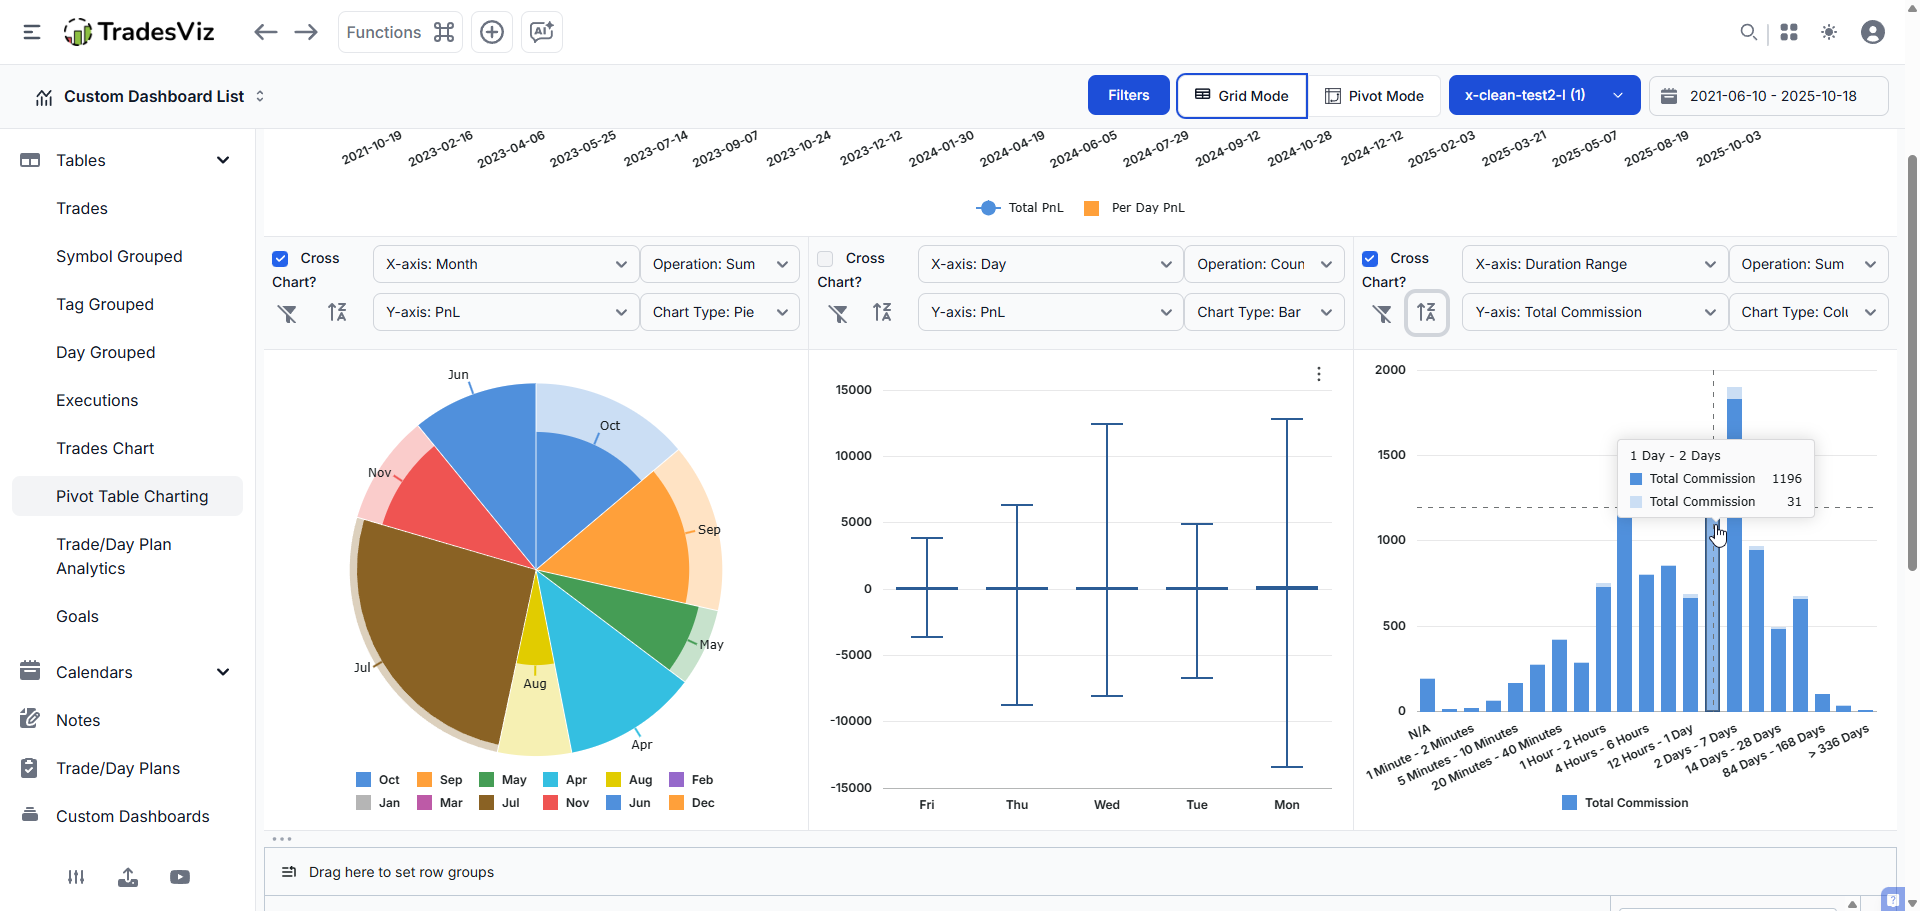
Do you spend more time _and_ money in a trade the longer in it? 🤔
Does your pnl range stay the same during the entire week? i.e, do you have "outlier" trades on say, Friday?
The pivot grid on TradesViz has answers to questions that matter.
Real trading analysis starts here.
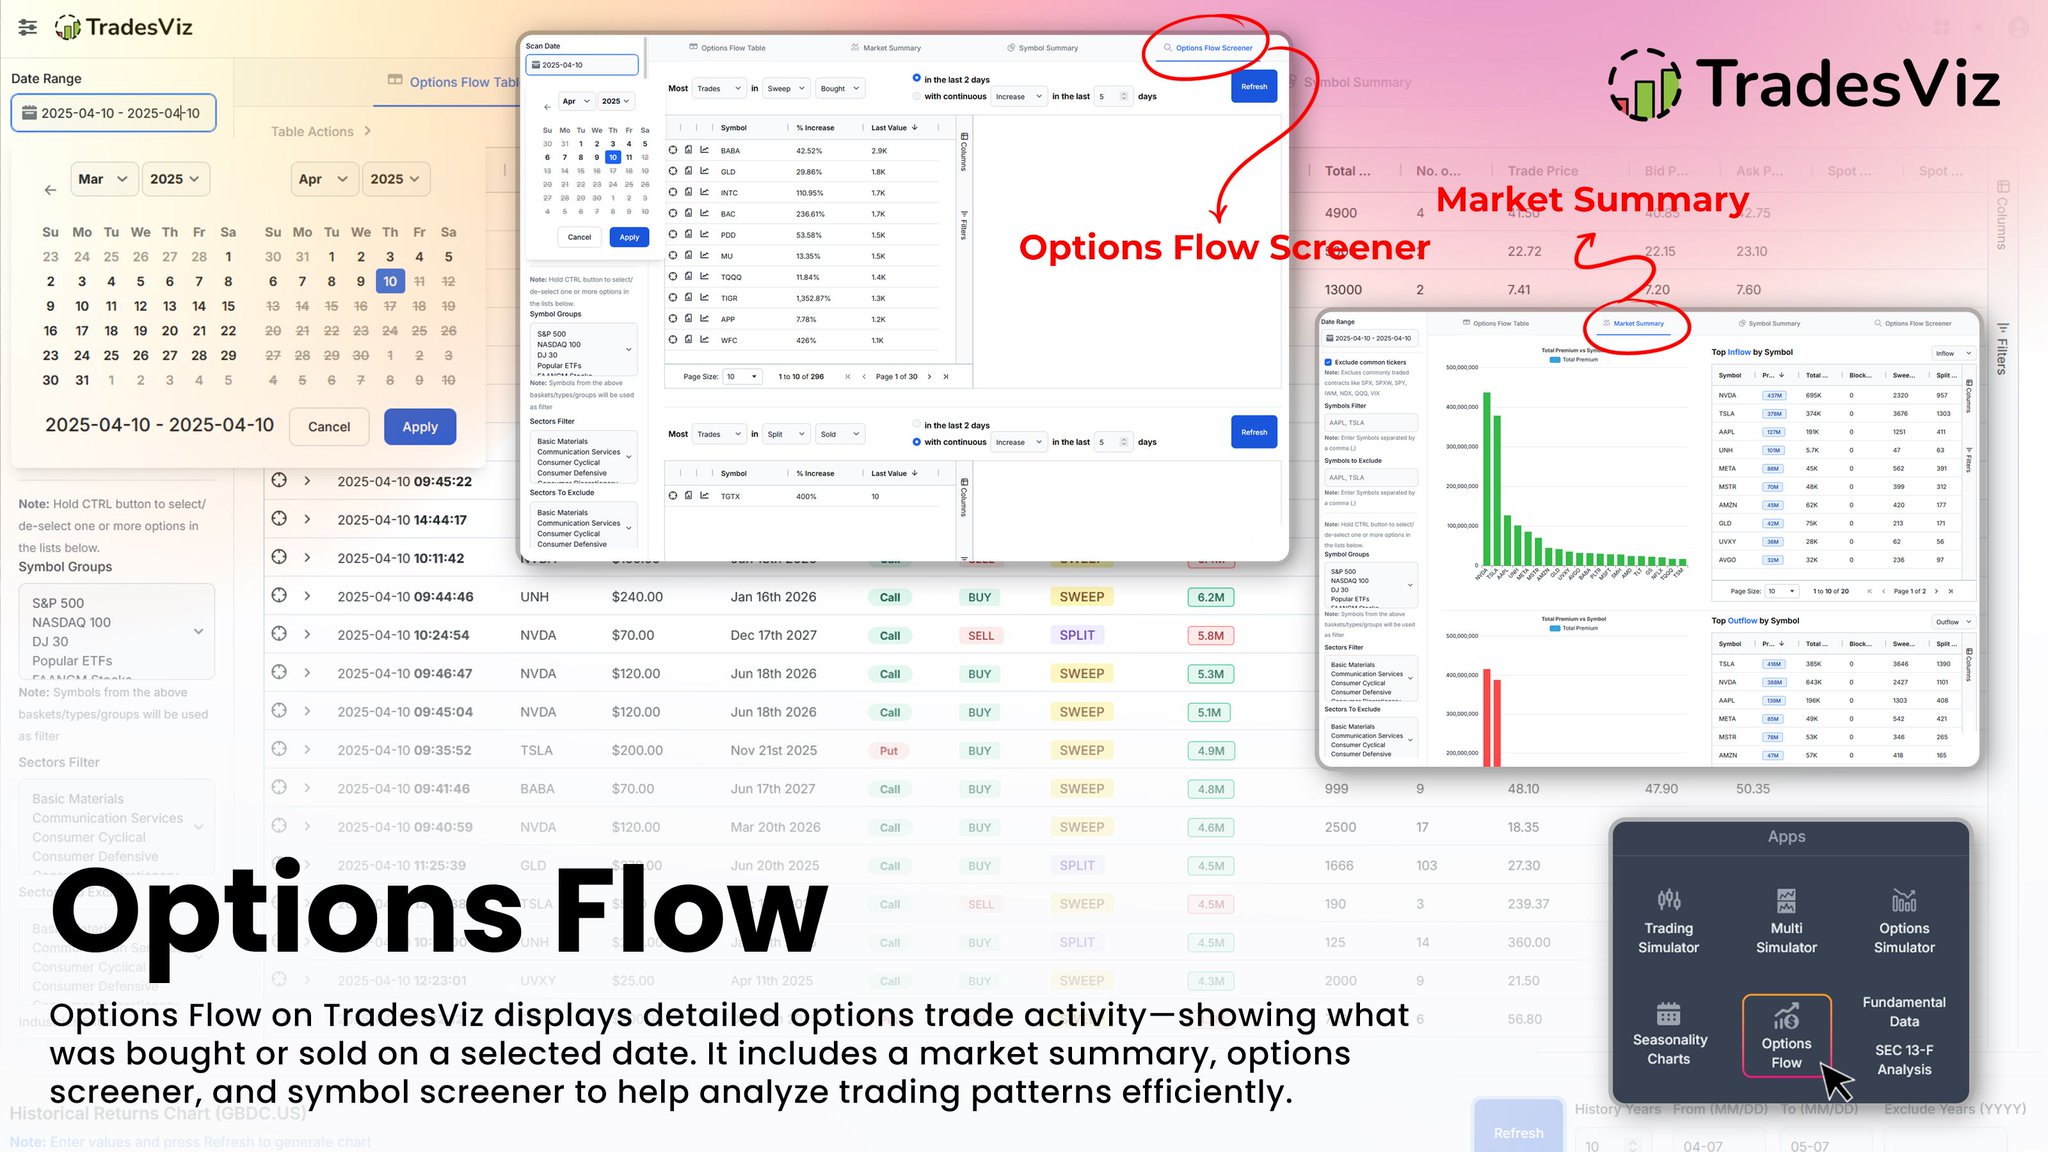
The *Options Flow* dashboard in TradesViz gives a clear read on where activity is building across the tape.
Every order, sweep, and split is organized by date, symbol, and volume — showing where conviction piled in, how positioning shifted, and which names lit up with significant flow.
The built‑in *Market Summary* and *Flow Screener* make it easy to track direction and follow consistency in real time ⚙️
It’s an efficient way to study market behavior through flow data, keeping the most active tickers and trends firmly on the radar 📈
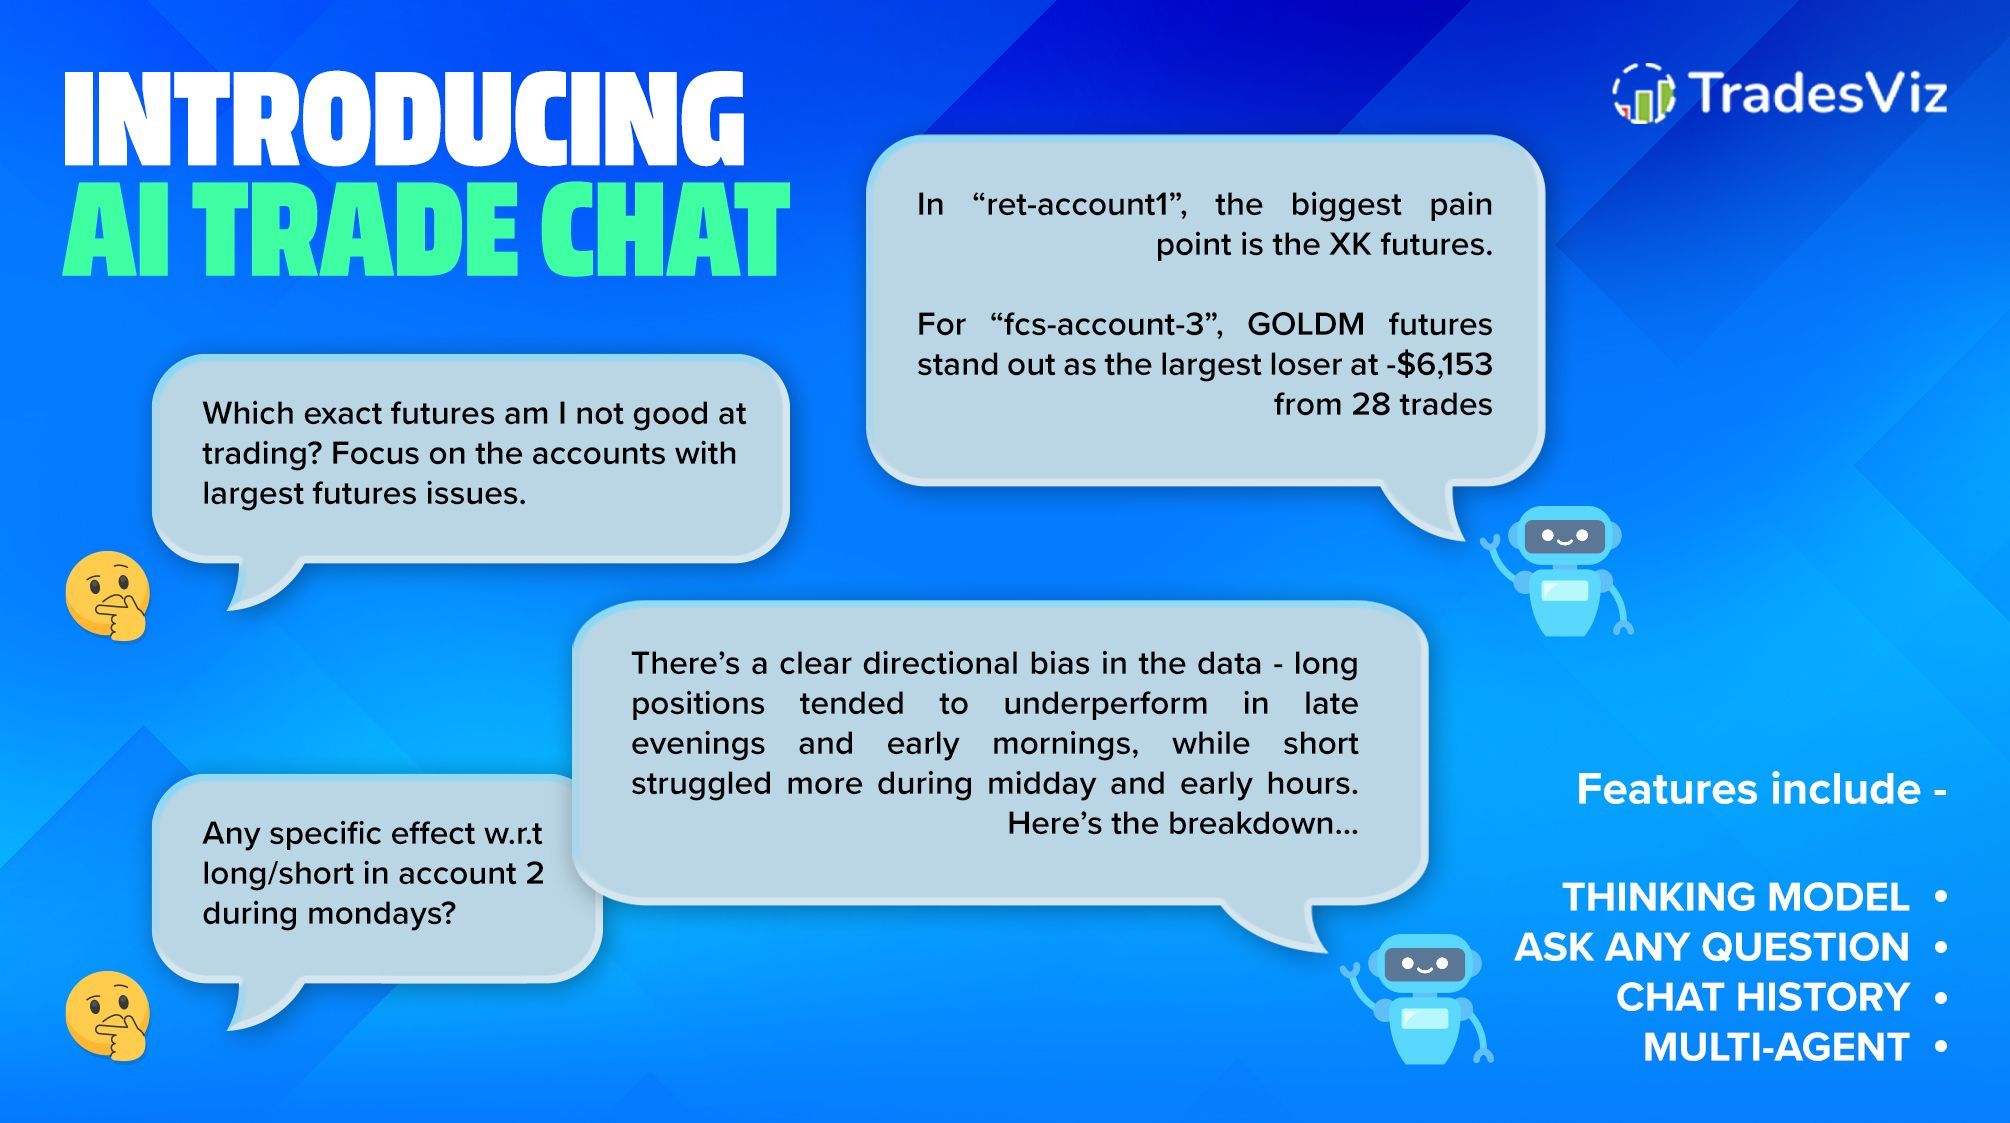
The new *AI Trade Chat* in TradesViz brings intelligent analysis directly into your workflow 🤖
Ask natural questions about performance, direction bias, or account risk, and get structured answers drawn from your own trading data.
Each response ties directly to metrics and positioning, so you see where conviction piled in — and where pressure built up ⚙️
It’s analysis that talks back, combining data awareness with context to keep clarity, precision, and insight always on the radar 📊
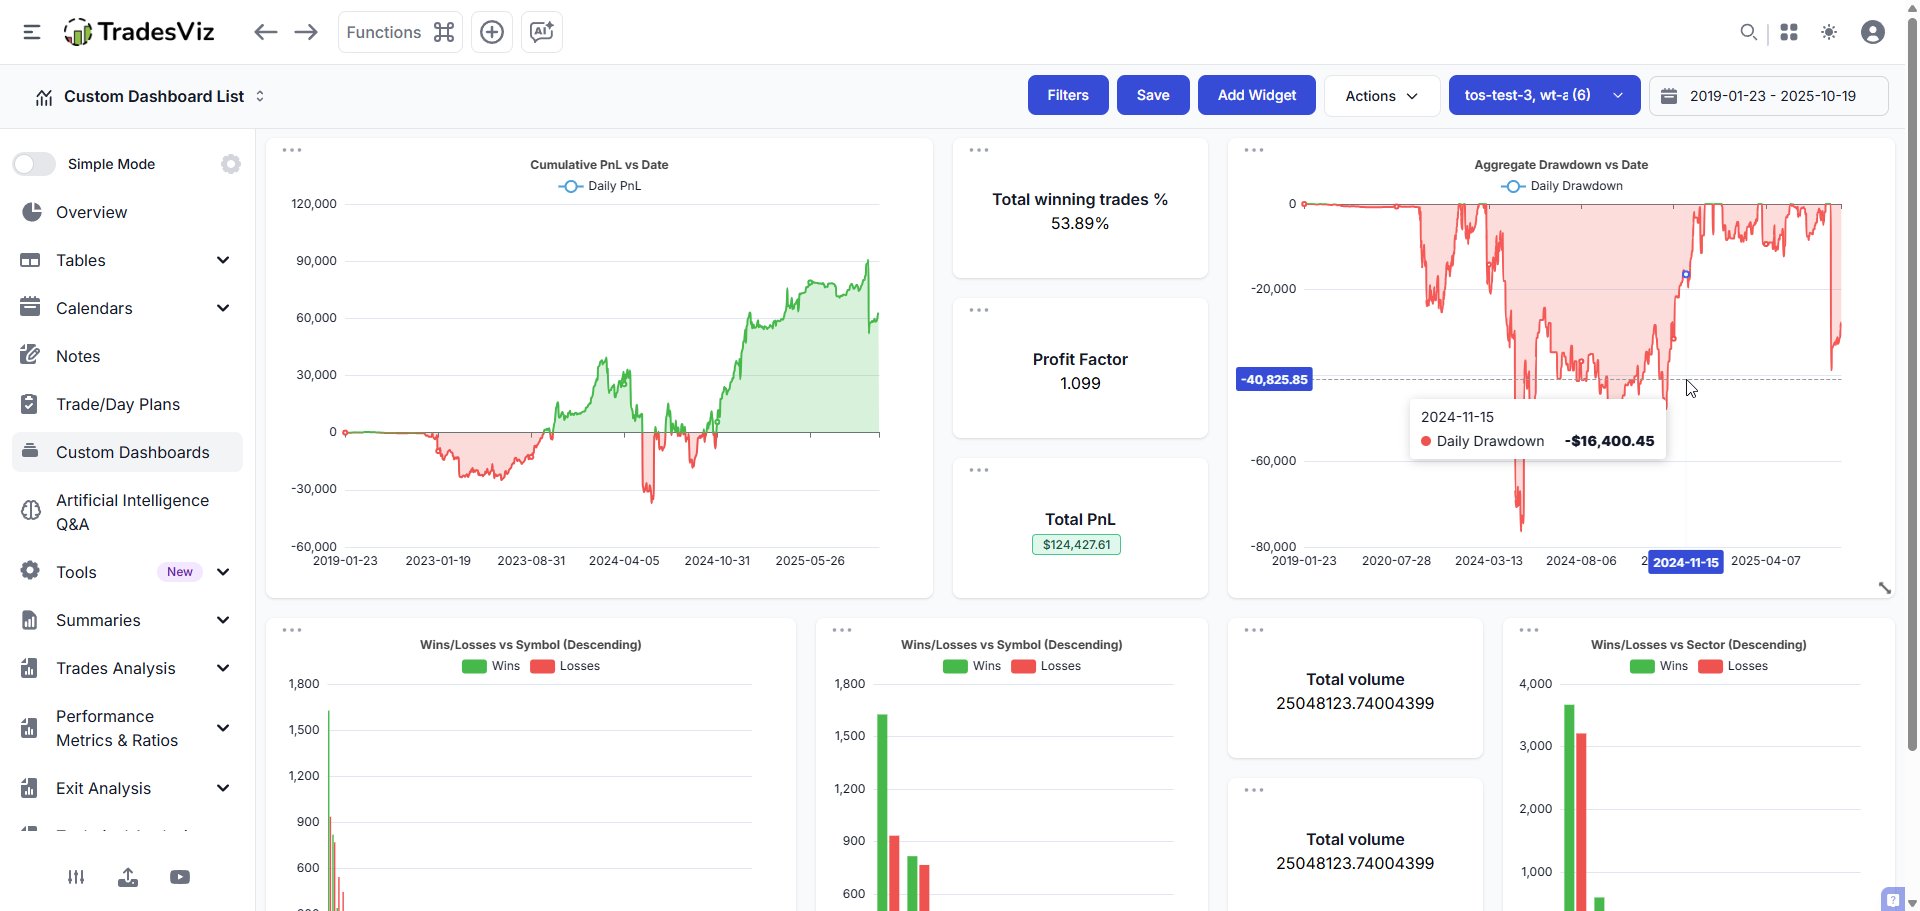
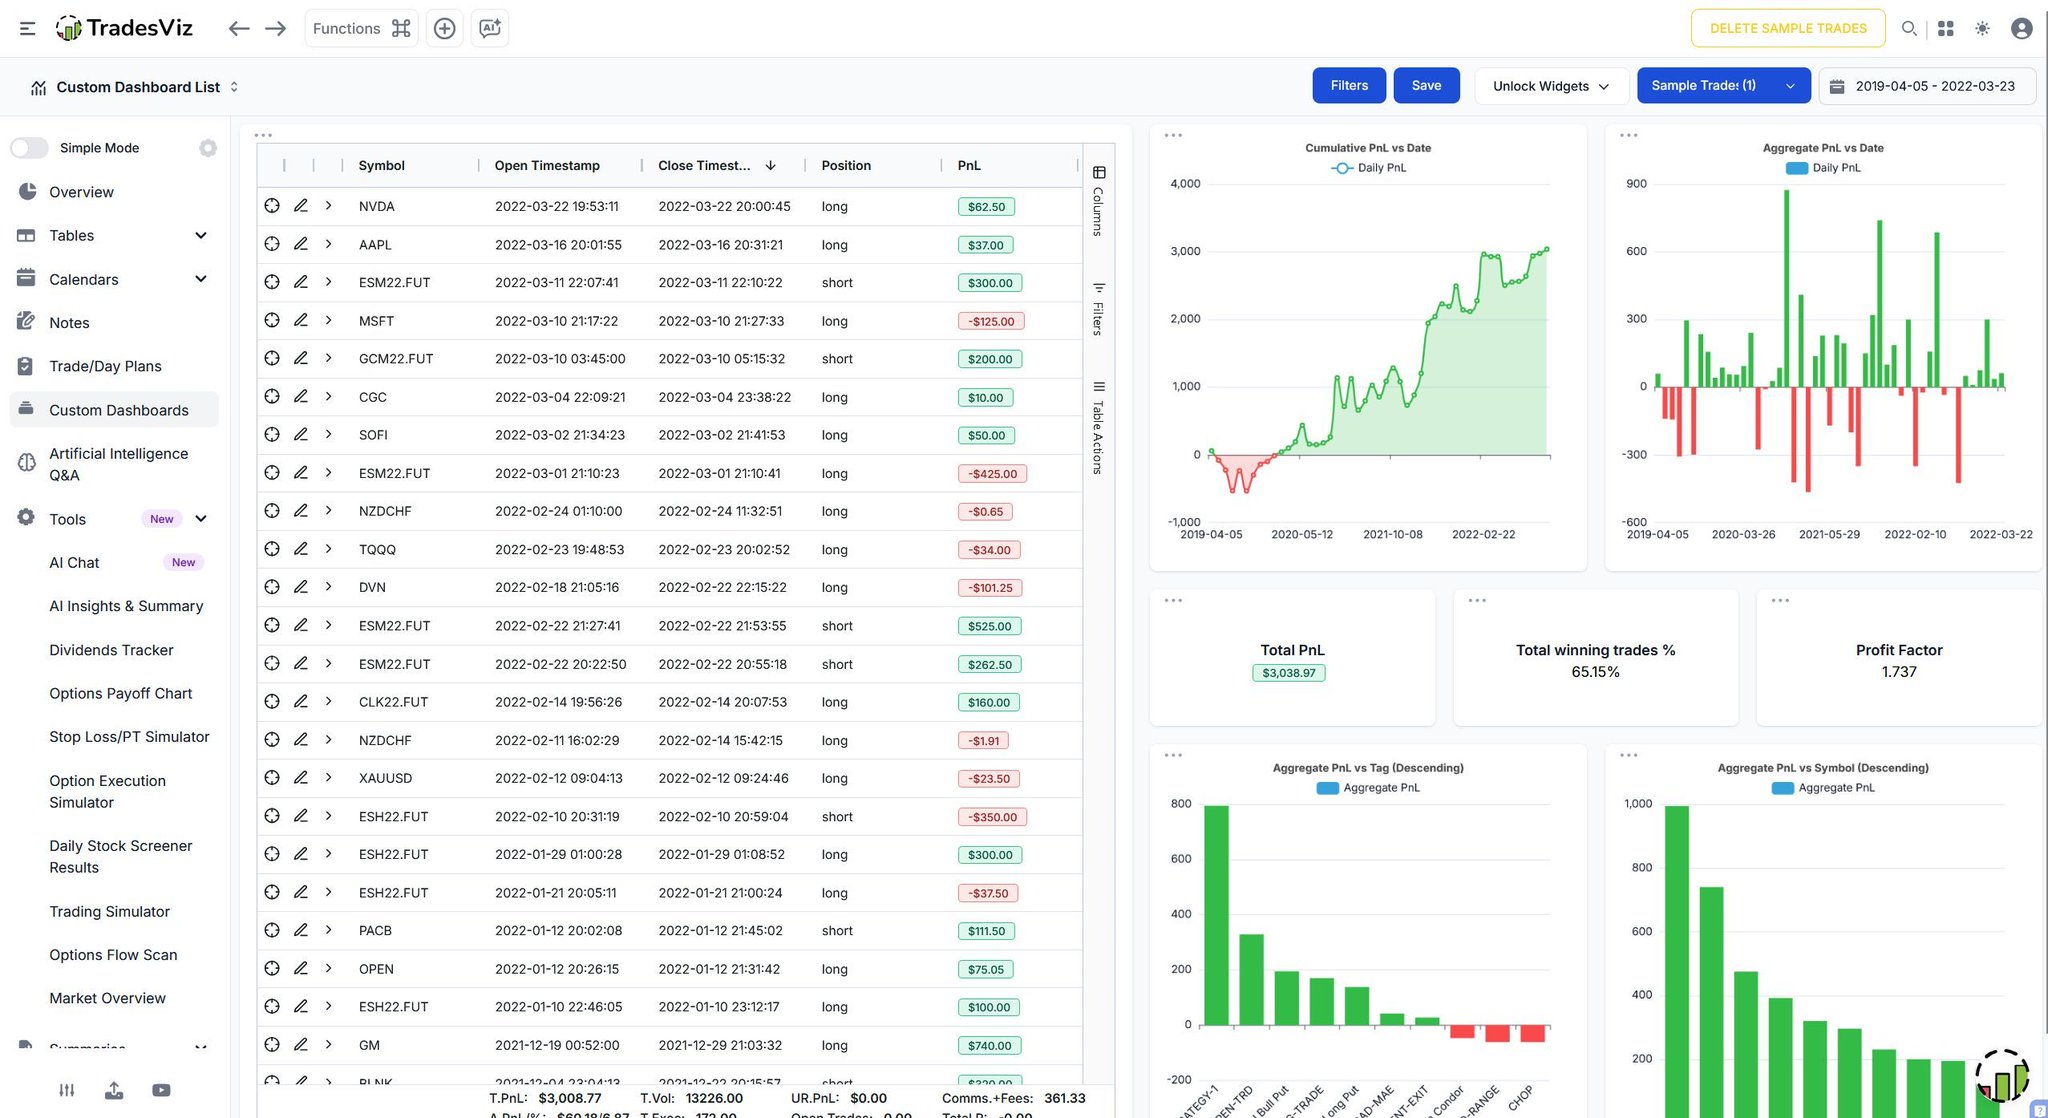
The *Custom Dashboard – Template: Table + Simple Stats 2* in TradesViz keeps analysis clean, functional, and directly tied to the tape 📊
Each trade lines up in a structured table beside concise visuals of cumulative PnL, aggregate returns, and summary stats. You see exactly how conviction translated into consistency — where positioning lit up and where flow thinned out ⚙️
It’s a ready‑made layout built for clarity. Fast, balanced, and fully customizable to your tracking style — keeping total performance and efficiency always on the radar 📈