Ok, you've landed on the best online trading journal and you're a bit overwhelmed and maybe confused as this is all new to you.
Don't worry.
This guide will take you from A-Z of TradesViz as fast and as short as possible teaching you all the basics of journaling and the most important features of TradesViz trading journal.
This guide is split into 10 short sections each containing a short video about that feature/section to give you a better context.
1. The dashboard
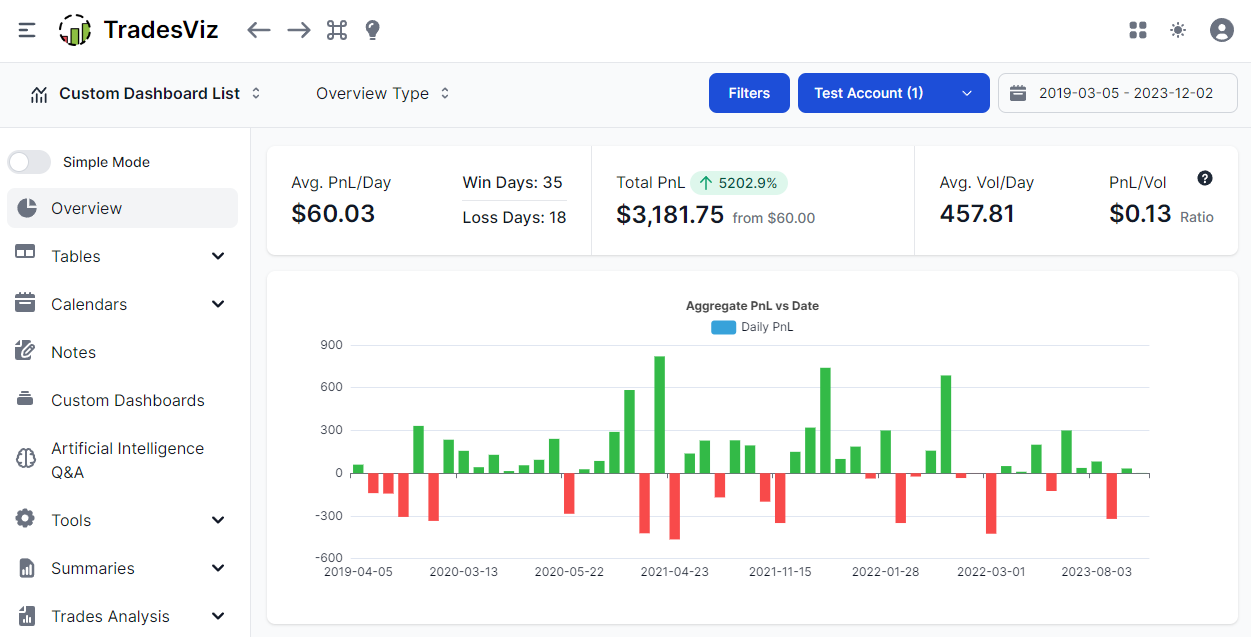
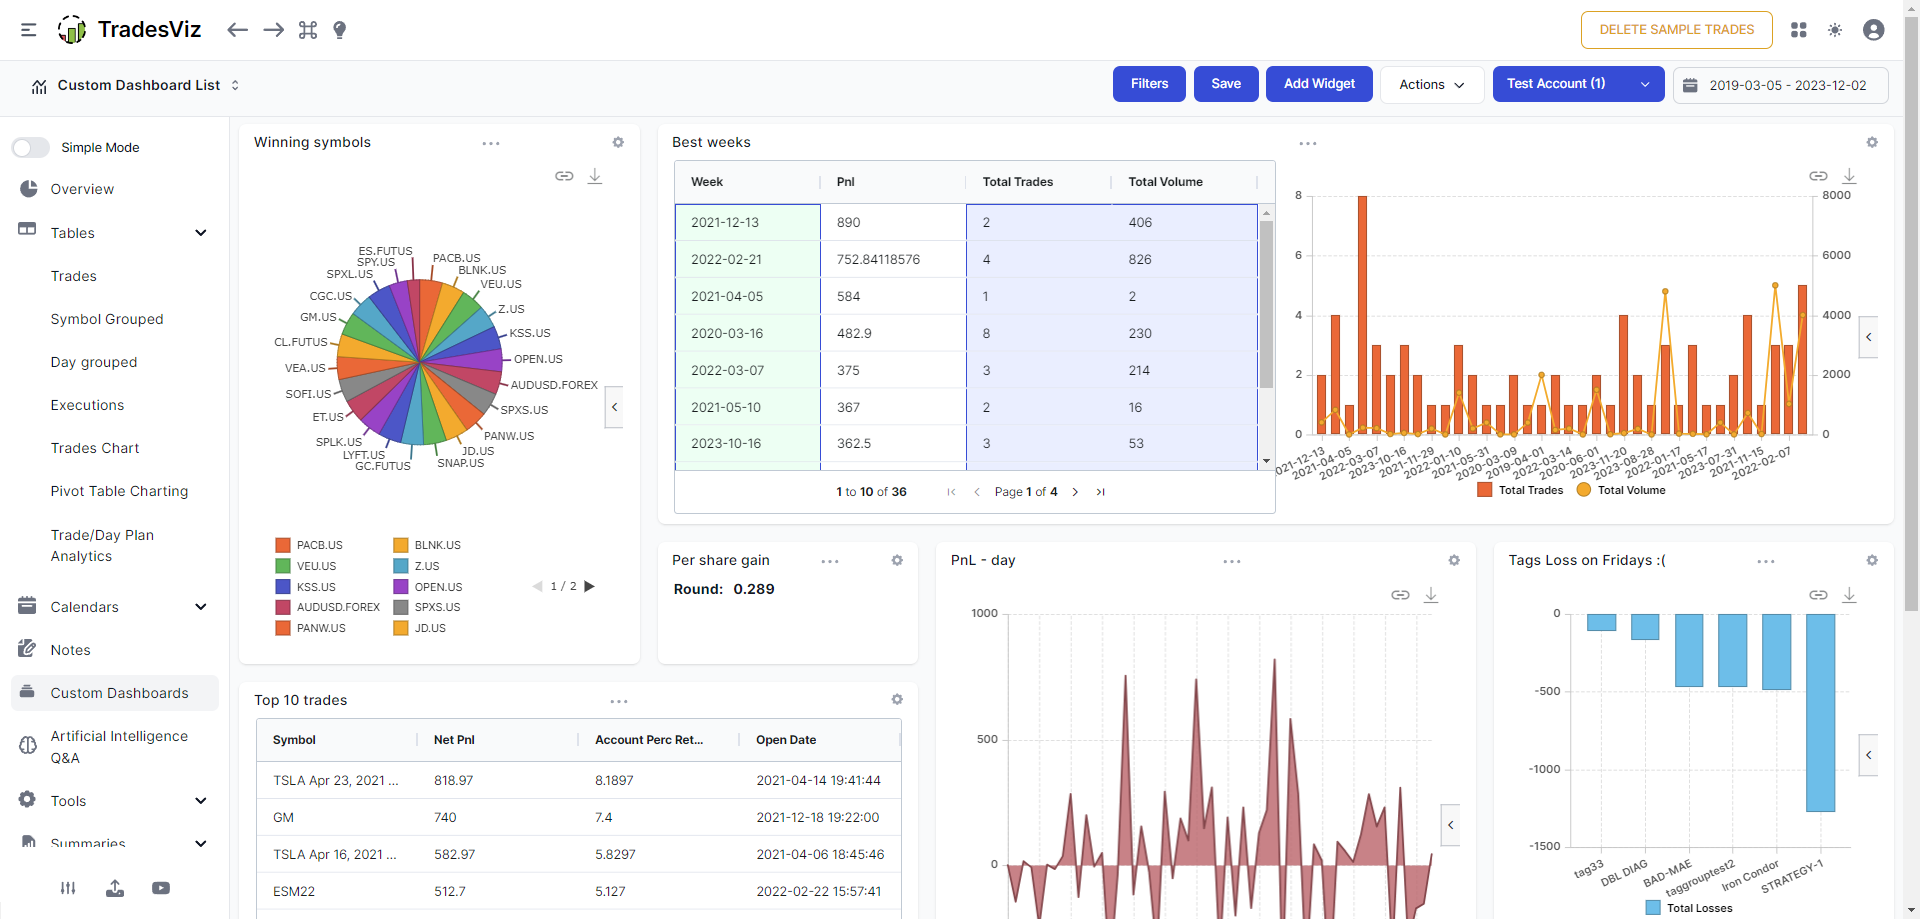
When you log into your dashboard for the first time, you will see empty charts and stats. Click on "Add sample data" button at the top right corner and within a few seconds, you will see your dashboard looks something like this:
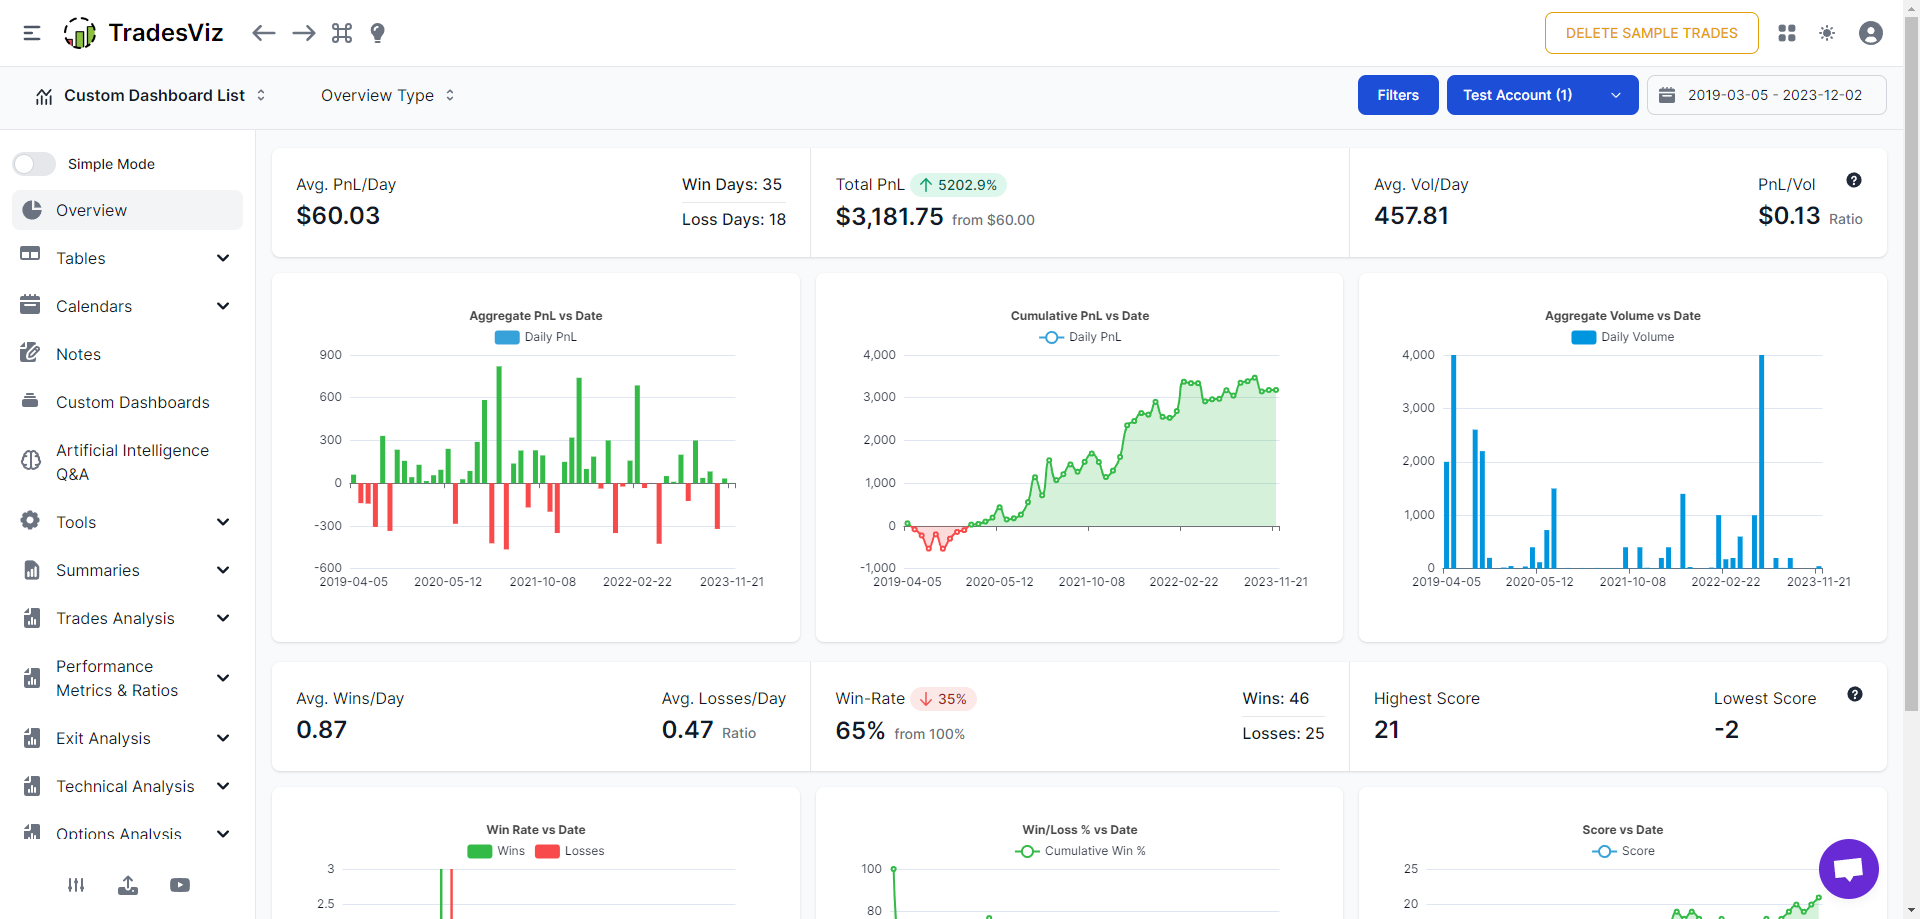
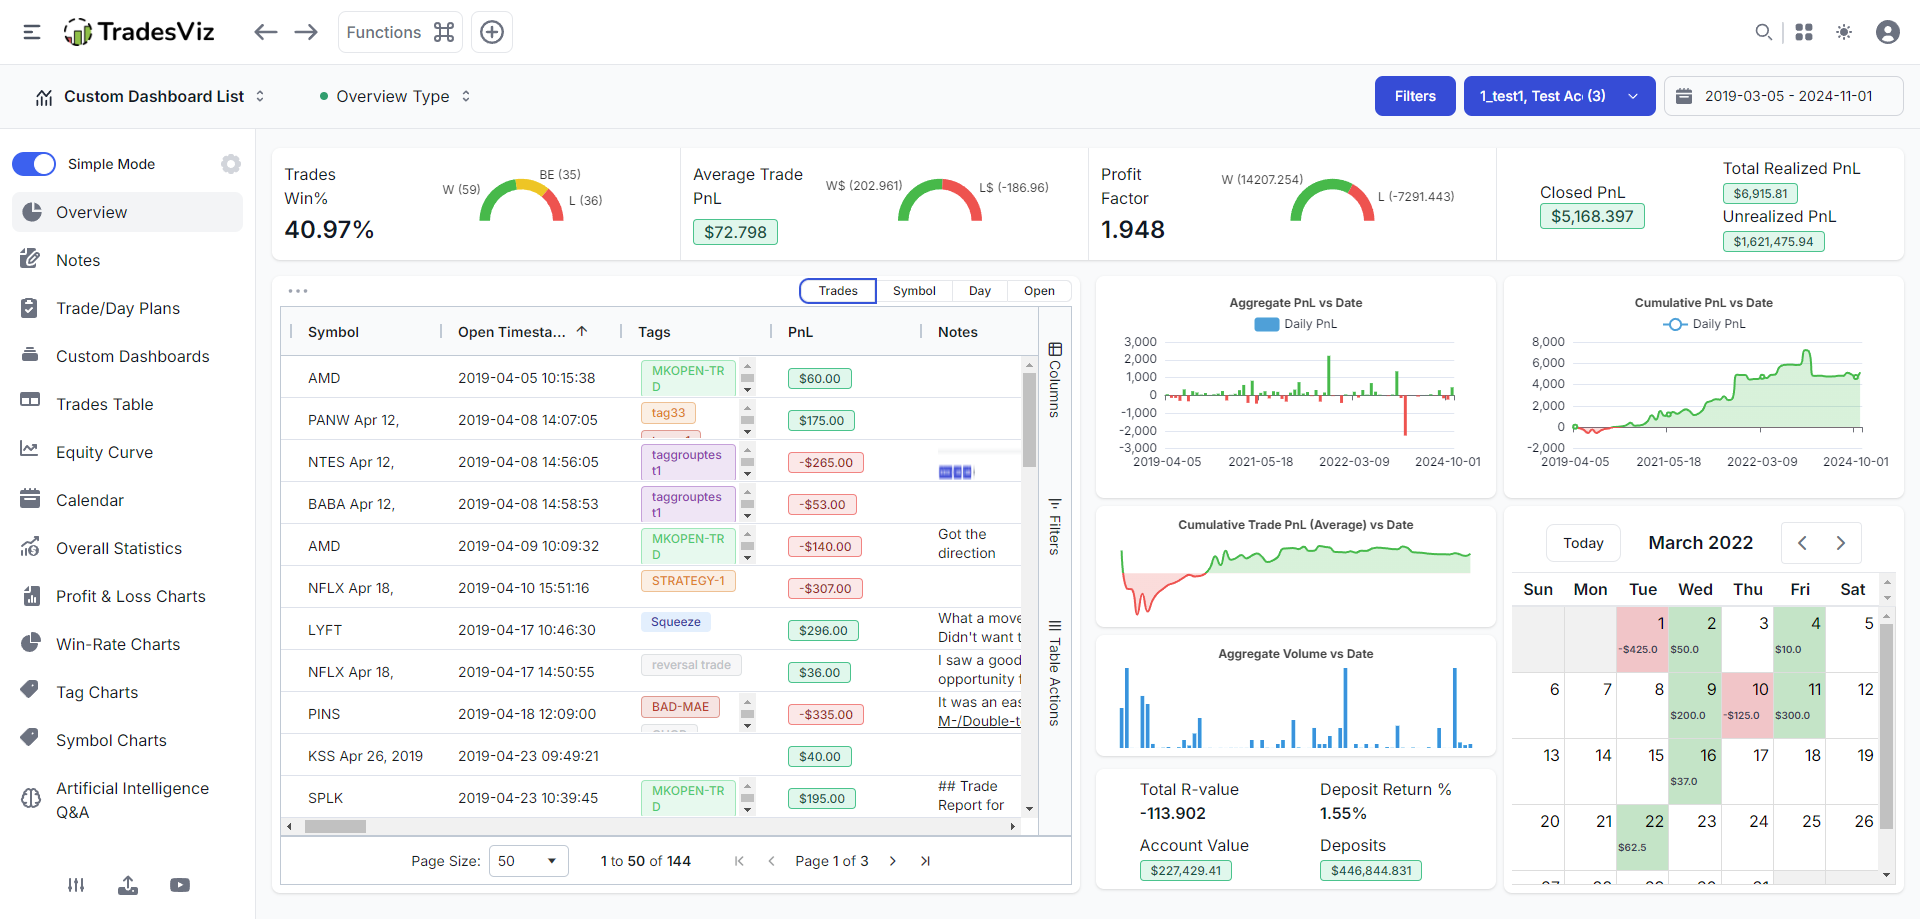
The dashboard is simple: you get charts in the middle, and there are tabs you can navigate to on the left side and the nav bar at the top - this is the Classic TradesViz dashboard. We have upgraded to the All-in-One dashboard that you can see here. Here's what the NEW All-in-one dashboard looks like:
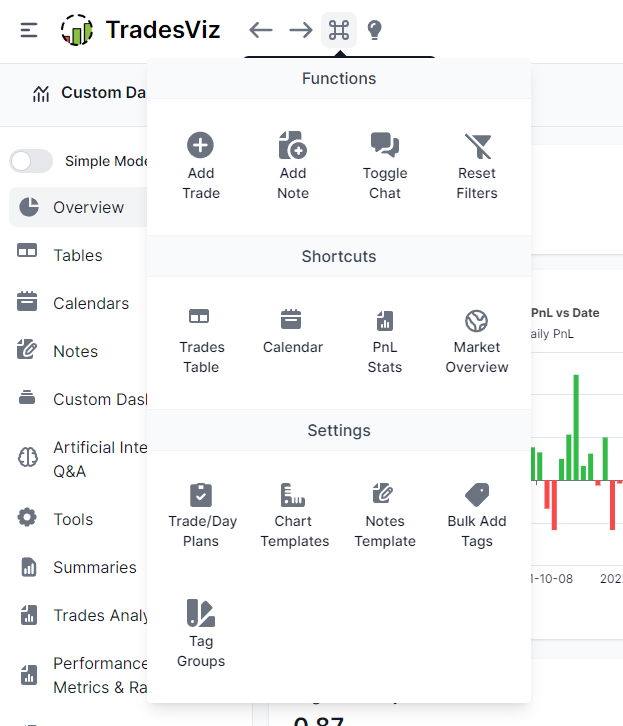
The navbar at the top changes its buttons based on the tabs you are in - for example, chart settings and filters based on different chart-based tables. The functions button at the top left corner (command icon ⌘) has shortcuts for useful functions like resetting filters, adding trades, reaching the important tabs, etc.,
If you think the side nav is too complex for you, switch on the simple mode. It shows you the bare minimum tabs required for effective journaling.
Important tabs to consider exploring:
- Tables > Trades: The bread and butter of trading journal - trades table. TradesViz's trades table/grid can do advanced filtering, multi-sorting, exporting, charting, and more!
- Calendars > Month view: What's a journal without a PnL calendar!
- Notes: All your notes in one place
- Custom dashboard: Original dashboard not to your liking? Design your own and set it as your homepage.
- AI Q&A: The next generation of trading analysis - ask any trading question about your trading data!
- Trades Chart: 100s of charts - every single one interactive (click on any bar/data point to explore)
- Summary > Overall statistics: All the trading stats - unrealized pnl, realized, total r-value, comms, etc., are available here
Here's a quick video walkthrough of the tabs and the dashboard:
2. Adding and managing your trades
You can add your trades manually, import csv/excel/html files, or auto-sync with your broker. All of these options are explored IN-DEPTH in our blog post here: https://www.tradesviz.com/blog/import-complete-guide/
Please skim through this to get a basic idea of how import and sync work. Ways to get to the import page:
Visit tradesviz.com/import [or] click on the profile icon on your dashboard (top right corner) and click on import/export [or] click on the upload icon at the bottom left corner of your dashboard.
We support 150+ brokers for manual import ~40 brokers/platforms for auto-sync/import. You can check the list for all here: https://www.tradesviz.com/brokers-list/
For auto-import, please check the section here: https://www.tradesviz.com/blog/auto-import-trades/
3. Adding deposits/setting account balance
One of the first questions we receive is - how to add account balance. You might have noticed a crazy high % increase number in the overview dashboard pnl curve. This is because the chart calculates the pnl % based on the left-most point and the right-most point which in your case might be 0 or some very small number.
To get the equity curve of the view of the account balance over time, head over to the "Equity curve" section under the "Summary" section and add your balances there. More info here: https://www.tradesviz.com/blog/deposits-withdrawls/
If you do not see any data in your overview page after important it is due to one of the following reasons:
- You have not selected the correct trading account/you have set the filters wrong (click on calendar > full range at the top right corner and then click on the filters and clear filters to reset filters)
- Your recently imported trades are all open (only fully closed trades are shown in TradesViz charts but you can view all trades in the trades table)
- No trades were imported because you are on the free plan and you tried to import non-stock asset types (you can only import stock asset types in the free plan)
- Your trade file has no trades or all trades are not formatted correctly (contact us with your file as an attachment)
- If you don't see stats like unrealized PnL, MFE/MAE, Best exit, and other advanced metrics, it's because these are calculated at the end of the day of import automatically by the system. You can force the system to recalculate it:
- To recalculate any single trade, explore the trade by clicking on the target button next to the trade in the trades table and click on the "Recalculate" button above the executions table.
- To recalculate many trades at once, you can use the group apply function. In the trades table, shift/control-select the trades you want to recalculate and click on the "Group apply" button at the top of the table. Now scroll down click on the "Re-calculate all selected trades" option and click "Save changes"
4. Important filters
Any advanced journal ought to have filters for quickly accessing your data. TradesViz is the best at it. If you have lots of data and want to quickly filter trades, use the filters like for open/close trades, long/short and of course, the entire trades table's columns can be filtered along with the chart data points.
Finally, if you have any questions about not seeing new data or not seeing any data, the solution is to reset the filters by clicking on the filters button and clicking on the reset filter icon or by clicking the command button and clicking on the reset filter button.
Here's a video that shows the following:
- Filtering using global filters (top right corner > Filters and calendar)
- Filtering using trades table
- Filtering using charts
- Resetting all filters
5. Tables
One of the highlight features of TradesViz v2.0 is that we have completely revamped every single table in every tab in TradesViz to use the most advanced grid/tabular technology. This means you can state the state of every table's sorting, column order, and more + you can chart and do visualization on tables! This is not possible anywhere else.
These new grids were inspired by how powerful our pivot grid was in the old TradesViz and we decided to extend this to all the trades tables. Under the tables tab, you will find many different types of tables:
- Trades table: A good 'ol table that has a list of your trades in each row. 70+ data points can be charted, filtered, and visualized seamlessly. It's like Excel but without the learning curve!
- Symbol grouped table: Similar to normal trades table, but outer rows are symbols and inner rows are trades made in that symbol.
- Day grouped table: Again, a similar pattern: outer rows are days and details of each day and inner rows are trades made on that day.
- Executions table: As raw as it can get: Every single execution/order is listed here. It is HIGHLY useful for quickly searching an execution from 1000s of trades.
- Trades chart: Every trader's dream visualization realized: View all your trades of any symbol in a single chart across any time period.
- Pivot table charting: The most powerful single-page analytics section you will ever find. Pivot, group, filter, chart, and do a lot more with the advanced pivot grid - exclusive to TradesViz.
- Trade plans analysis: Ever wonder how well you are trading according to your plans? How well you are following them? This tells you all about every single plan and gives you a summary of all your trade plans.
Here's a video showing all of these tables and some of their functions:
6. Important charts/metrics/stats
Of course, no journal is complete without charts of your statistics and you'll be happy to hear that we have around 200+ of those charts from pnl, volume, exit, time, risk, and more.
This is where a lot of traders feel that there is a lot to learn and that it takes time. But here's the thing: Focus on just 1-2 tabs and ~5 charts for now. Surely anyone can do that.
Based on our own experience and feedback from users, these are the tabs that we think are the most useful to beginner traders:
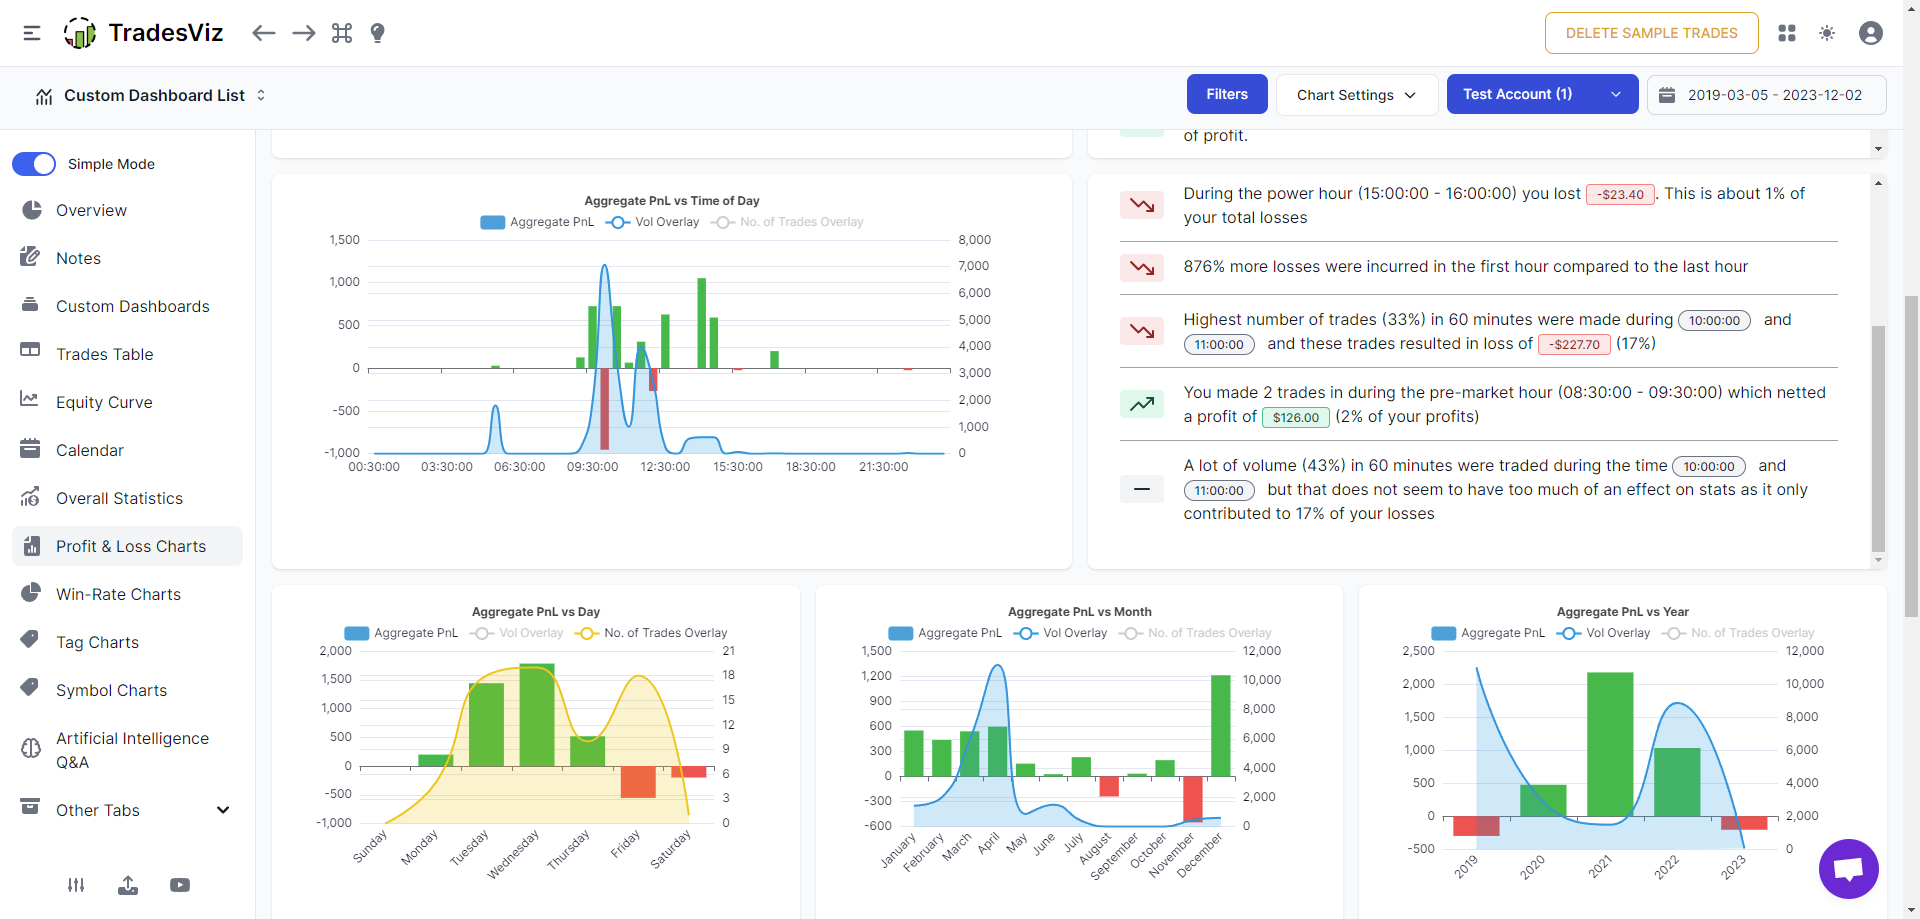
- Profit and Loss Charts (Contains all basic charts with pnl as the Y-axis):
- PnL vs price range
- PnL vs volume (traded) range
- PnL vs duration
- PnL vs time of day
- PnL vs Day of week/month/year
- PnL vs side
- PnL vs asset type
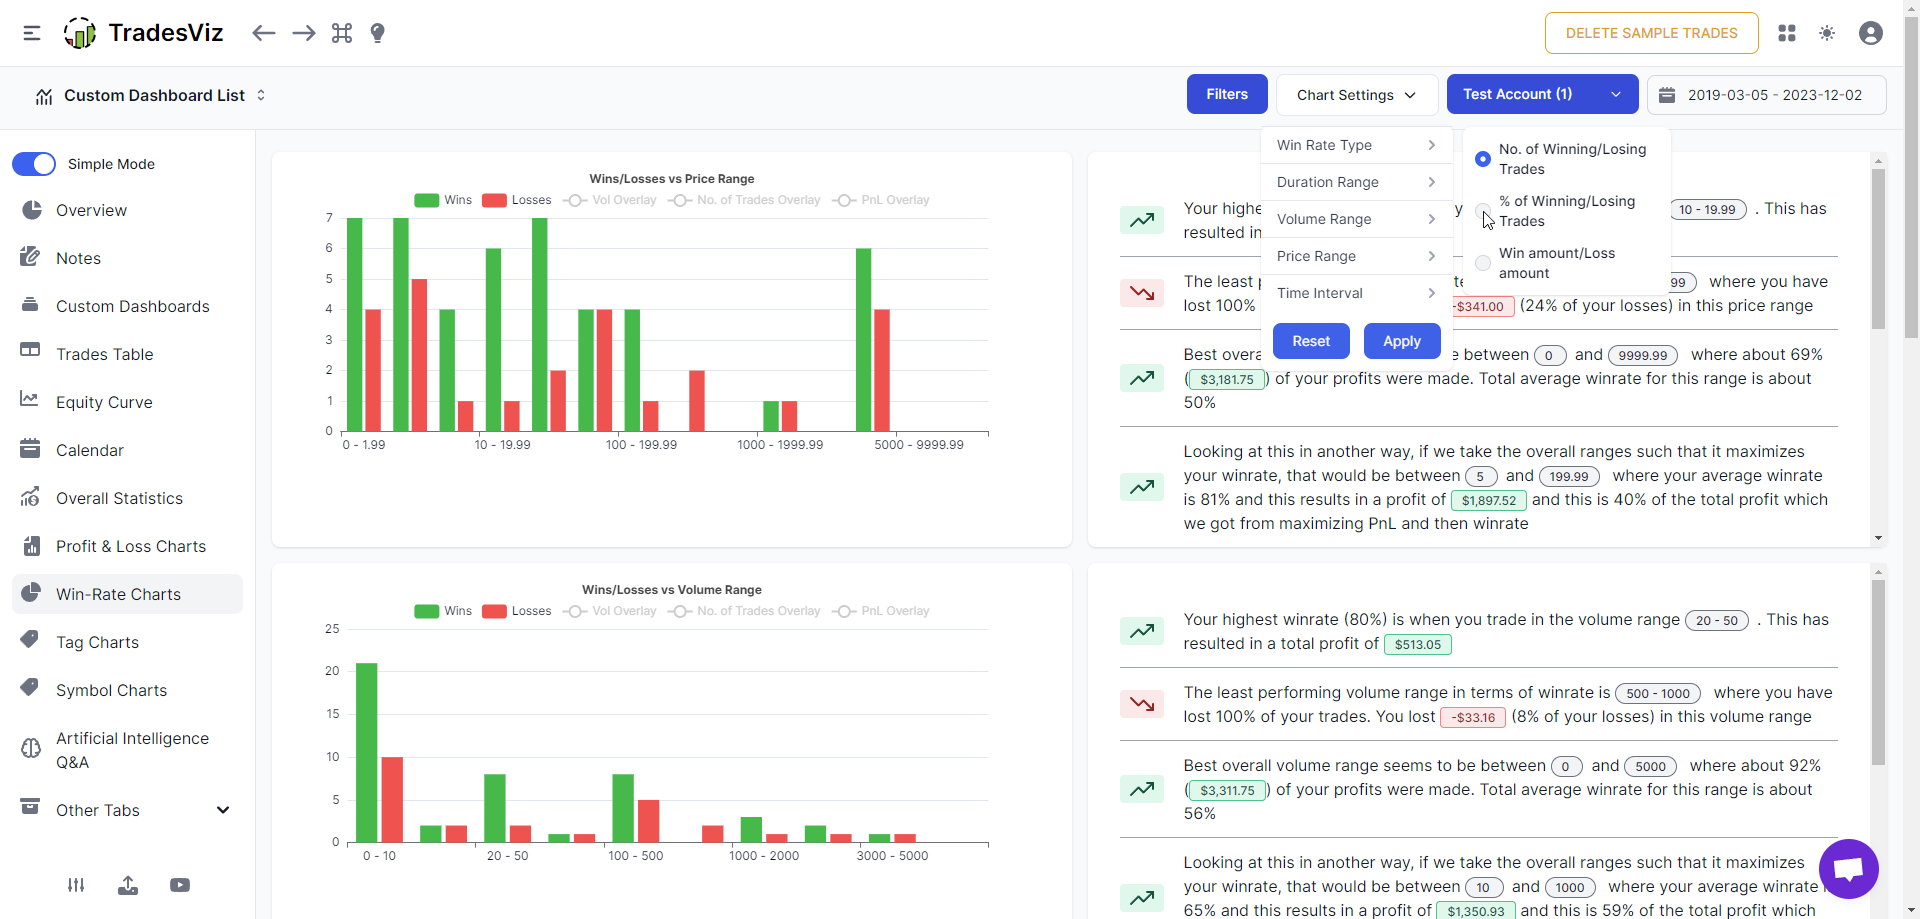
- Win-rate charts (similar to above, but with Win-rate in Y-axis). Note here that you have the option to switch between win %, no. of wins, etc., via the chart settings at the top navbar:
- Tags charts
- Symbols charts
These 4 tabs are also part of the simplified dashboard mode. This is NOT an exhaustive list. There are a lot more charts that you can explore and we have in-depth blog posts for some of the more advanced ones such as exit analysis, MFE/MAE, and risk metrics. Here's a short video of some of the char tabs you will see:
Another solution to this is creating a custom dashboard with just the charts you want. This is what we will explore in the next section.
7. Customizability
The strong feature of TradesViz is not only how extensive its anlaysis is, but also in how you can mold and shape TradesViz to fit your trading style and needs. This is where the custom dashboard changed the game forever in the field of analytics in journaling. TradesViz trading journal is the first to have a 100% custom dashboard that has over 600 widgets and it is still unbeaten in this aspect despite much new "competition". We've made the custom dashboard one of the always active dropdowns in the new dashboard because of how often it was used and liked by our users. You can access, create, and use as the default homepage any custom dashboard right from the homepage.
You can add as widgets:
- Charts
- Stats/Stat list
- Calendar
- Trades tables
- AI widgets (unlimited possibilities)
Here's a popular pre-built dashboard format with all the basic widgets:
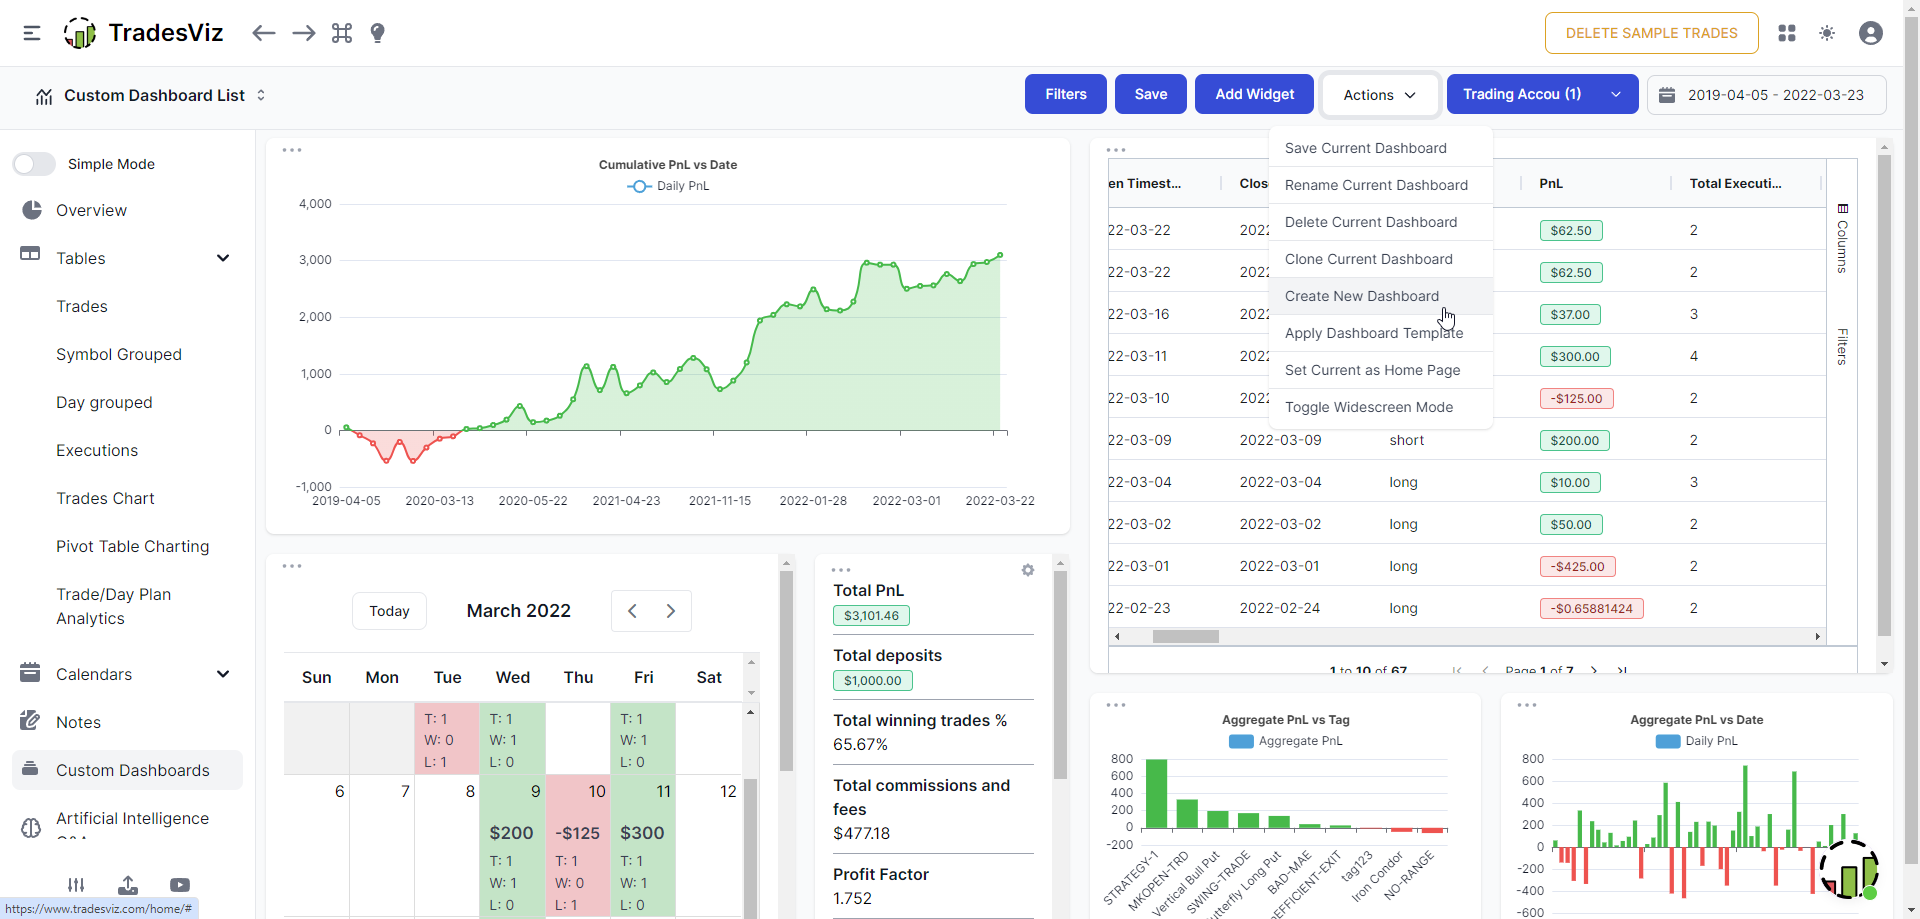
Finally, you can save the dashboard after editing it by clicking on the save button and setting it as a home page by clicking on the "Action" button and then "Set as home page". All of this can also be managed by the account settings. Here's a short video of creating a simple dashboard:
8. AI Q&A
The future of trade journaling is available only on TradesViz. While AI may not completely replace humans in trading, we humans trading can certainly make use of AI to augment our data analysis and that's exactly what this feature is for.
You can ask questions like:
where symbol is AAPL or PACB and tag is CHOP
grouped by day
etc. .etc,
to advanced queries like:
show average pnl and calendar day of week for all such days
show calendar day as abbreviations
The possibilities are... endless with the AI query on TradesViz. This is the first and the only online trading anlaysis platform to have a real, working, proven system that traders are using every day. Thus far, users have generated thousands of unique queries - this means, thousands of statistics and charts that are not available anywhere else. If you need help with a query, you can always contact us at [email protected].
Here's another cool feature: You can add the result (table and/or chart) of any query to your custom dashboard making it truly 100% tailor fit for your trading.
More about AI query to read in order:
- https://www.tradesviz.com/blog/artificial-intelligence-query/
- https://www.tradesviz.com/blog/ai-query-examples/
- https://www.tradesviz.com/blog/advanced-ai-journaling-guide/
- https://www.tradesviz.com/blog/ai-custom-dashboard-widgets/
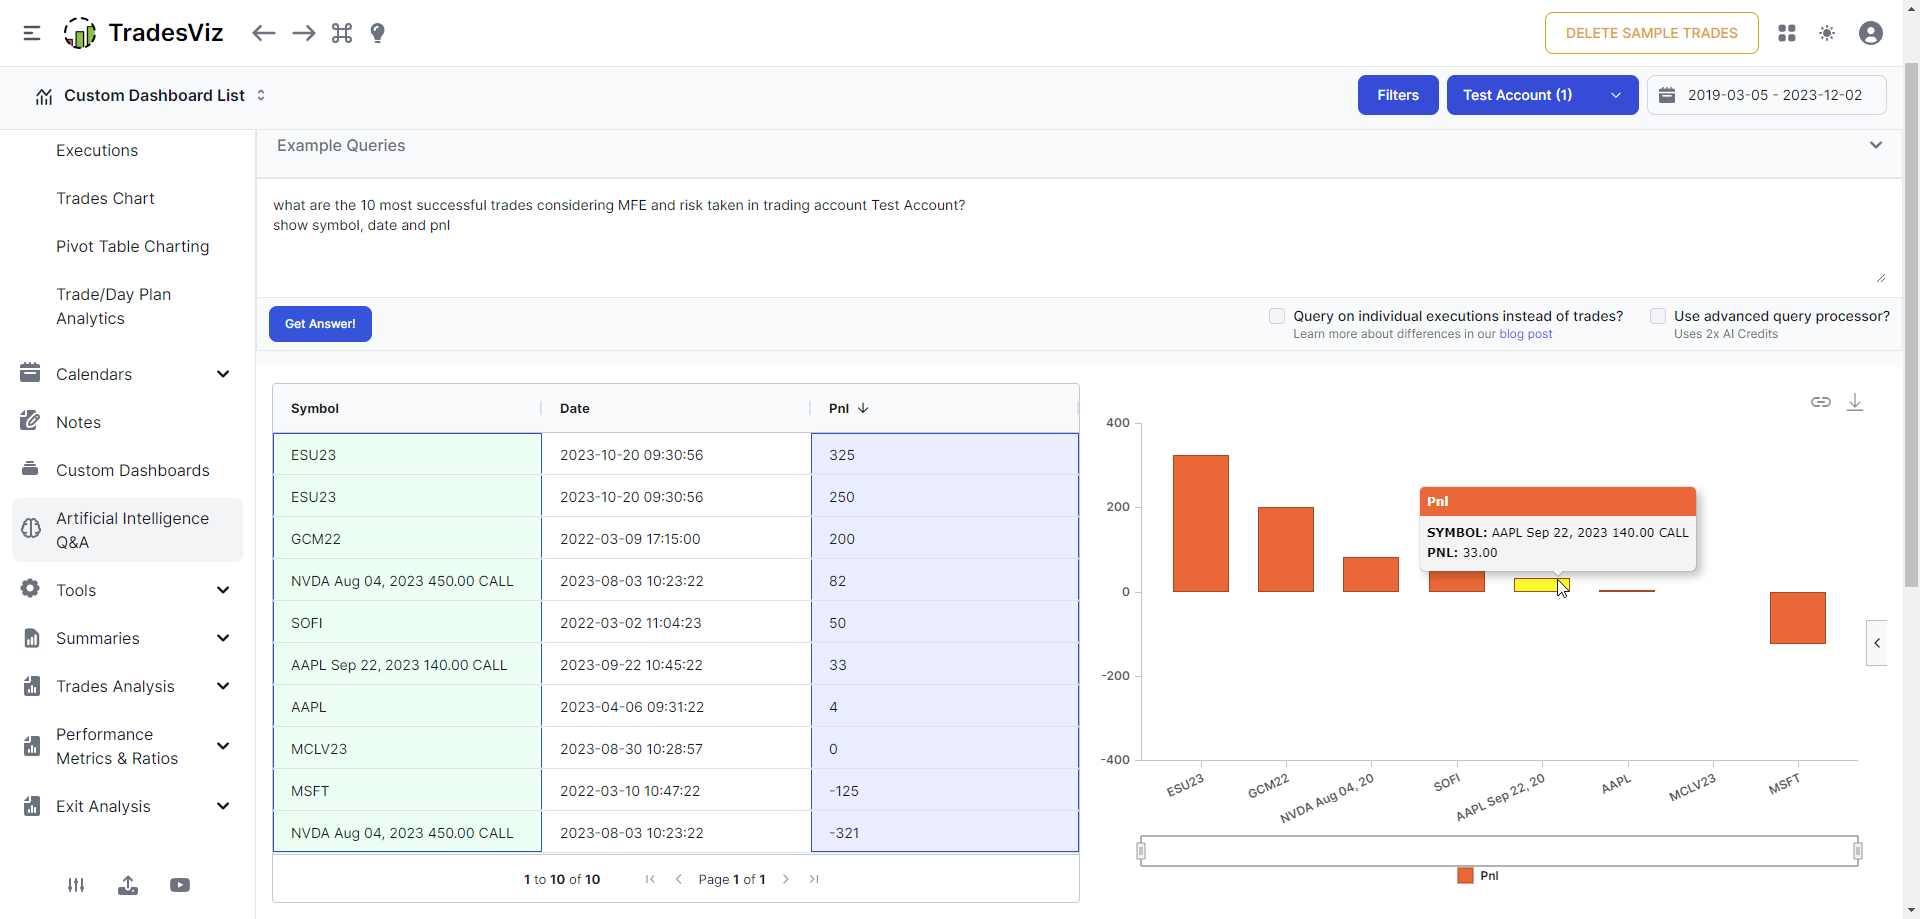
Here's a dashboard with AI widgets:
If you are fully utilizing these features, you are already a pro trader! The amount of powerful, real, and actionable insights these features can provide you are one-of-a-kind! You will not find them ANYWHERE else. This is what makes TadesViz a leader in trade journaling in the world.
9. Account management
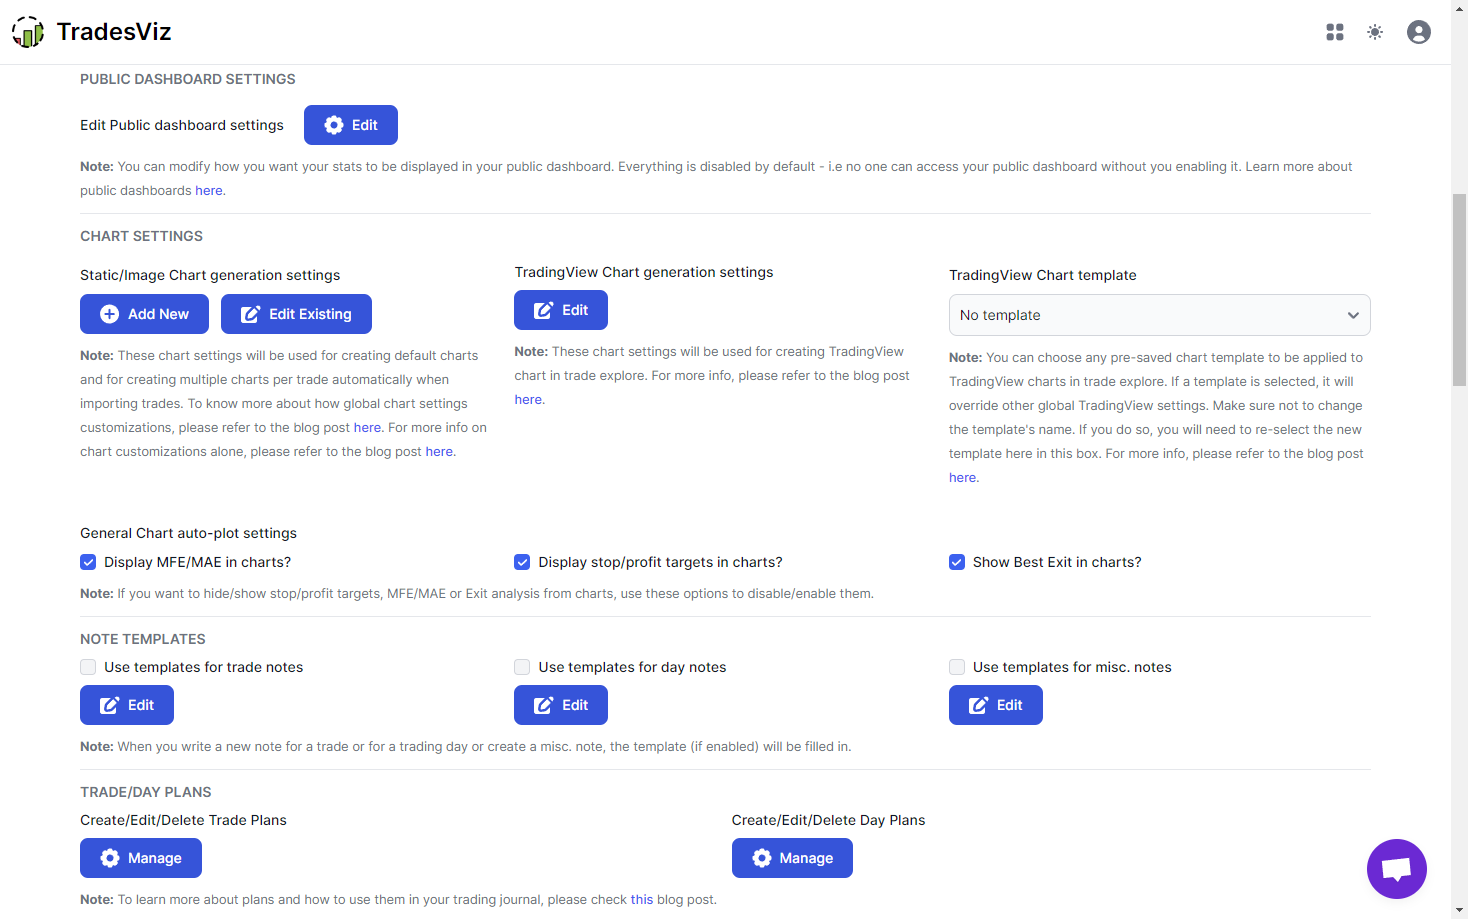
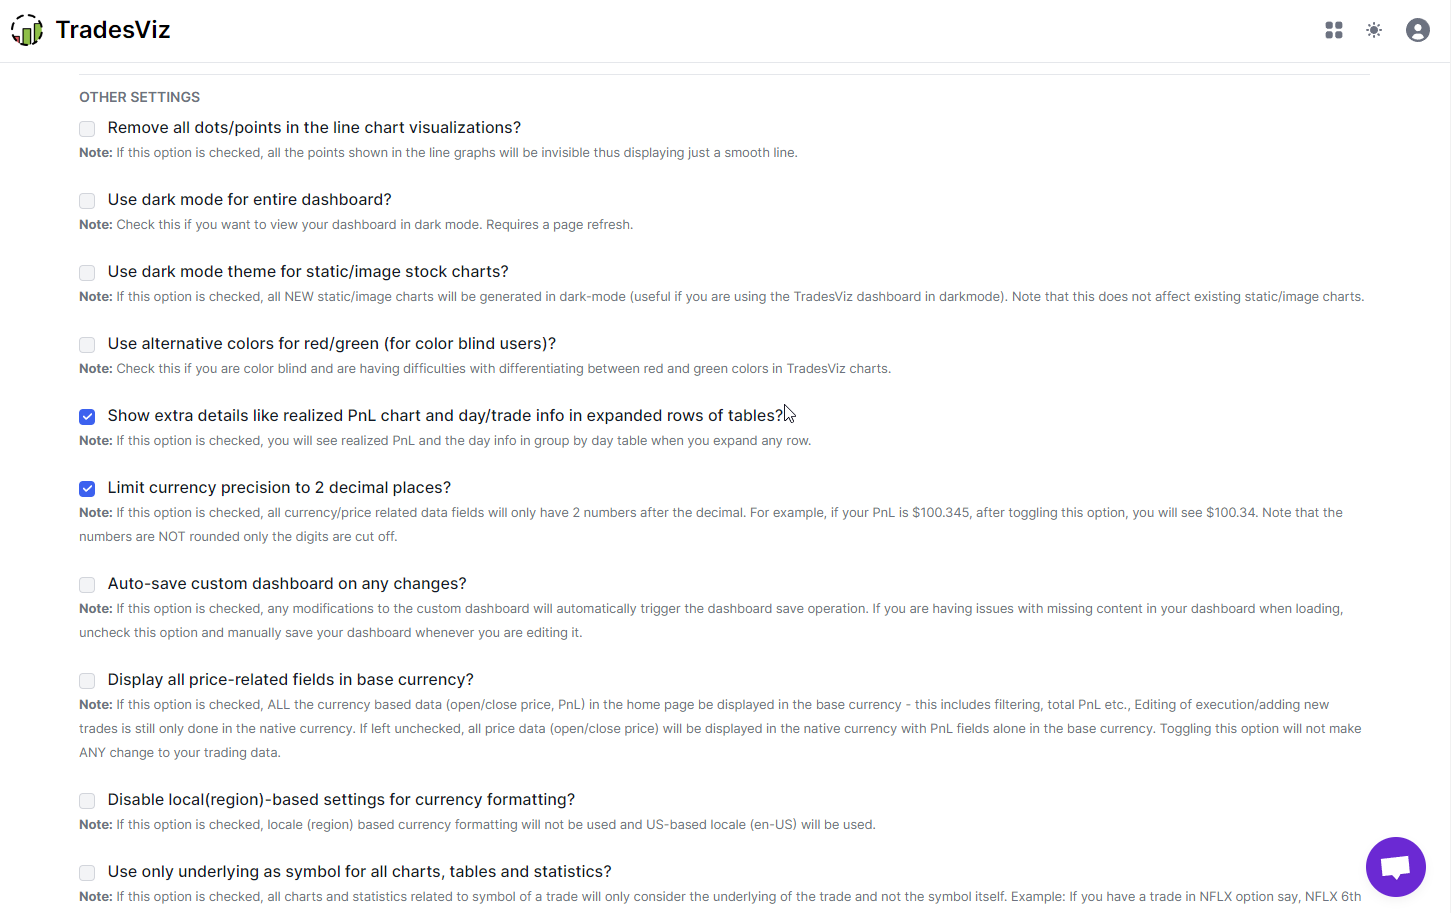
Emails, passwords, trading accounts, and the control panel of your TradesViz account. It's all on your account settings page: tradesviz.com/accounts/settings.
The default for all new accounts is US/Eastern as timezone and USD as currency - if you are not in this region or do not trade US assets, you can change the settings here. There are plenty of other settings also most of which are self-descriptive.
The subscription tab is also part of this page. If you are using Stripe, you can manage your subscription (upgrade, change, cancel) by clicking on the Stripe manage button in the subscription tab. If you are on Paypal, as noted on the subscription page none of these are possible except for cancelation which too has to be done on your PayPal's dashboard's subscription list.
On top of this, you can see your referrals and also set the sharing settings to share your accounts/charts (view-only) with other Pro/Platinum users. You can read all about sharing on TradesViz here: https://www.tradesviz.com/accounts/sharing/
10. Misc. features
By now, you would have realized that TradesViz is a very powerful trading journal able to features that are not available anywhere else. On top of all of this, we have the following to make TradesViz an all-in-one trading companion:
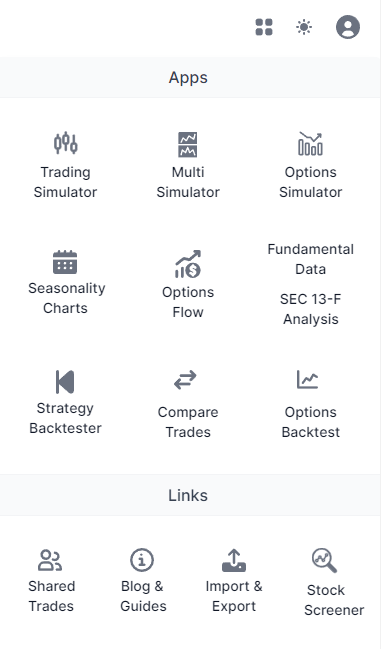
- Single Trading simulator
- Options chain simulator
- Multi Trading simulator
- Options flow/Options scan
- Options execution simulation
- Seasonality
- Backtester
- Fundamentals
- SEC13F
You will find shortcuts to all of this by clicking on the 4 blocks icon at the top right corner of your dashboard:
Spend your time learning the basics of the journaling features of TradesViz and slowly start using the other features to get the full benefit of TradesViz. All these features along with the world's best journaling and *real* AI features make TradesViz a must-have for any trader. Considering all of these as separate tools, you would be paying at least $200-300/mo to get subpar features. But with TradesViz, you are getting constant updates, new features, and more for less than $30/mo. Is there a better deal? Do you think there are alternatives? No. There are none.
You may not use all of these features immediately, but based on conversing with new and long-time users, you will start to naturally use them as you journal your trades and progress in your trading journey. TradesViz v2.0 has been designed with the goal of simplicity in mind - whilst not compromising on features or flexibility.
For example, you may want to replay your trades - that's where the simulator comes in. You may want to rebalance your portfolio based on trends - this is where fundamentals and seasonality come in. Maybe you want to prepare for an earnings option position? Try the options flow. For the many use cases you may face as a trader, there are many solutions TradesViz can offer you.
All of this takes barely 1-2 days to get used to. For a tool that can help you for years to come and a practice (trade journaling) that has been proven to work in improving trading for decades since the very inception of record keeping/journaling.
Every single feature/chart/metric is carefully designed to help you squeeze every bit of insight from your trading data. TradesViz is not your run-of-the-mill trading journal. TradesViz is used by prop firms, professional traders, portfolio managers, and veterans in trading. We designed TradesViz to serve the entire spectrum of traders - irrespective of a trader's experience, what assets you trade, or what your account size is. There is something TradesViz can offer to every type of trader.
Finally, you have our full support - via chat or email. Ask your questions and our support team will be ready to assist you at any time.
We hope this serves as a useful guide map for all new TradesViz users who are looking to start journaling their trades. We want to be successful in your trading journey - journaling is one irreplaceable part of it and we are trying our best to improve the journaling and analytics experience you get on the platform every single day. Our wish is for TradesViz to help you become a consistently successful trader.
That's all the info you need to get started on TradesViz. Explore our blog to learn more about the features of TradesViz and stay tuned for more updated How-to videos and blog posts. If you have any questions or feature requests please don't hesitate to contact us at [email protected]!