We have so far had realized PnL charts that are available in both the day and trade explore views at the bottom. With a lot of swing traders also looking into robust journaling solutions, we have now implemented a realized PnL graph that shows your entire trade if closed and till current date/last available data if the trade is still open.
Let's view a few examples.
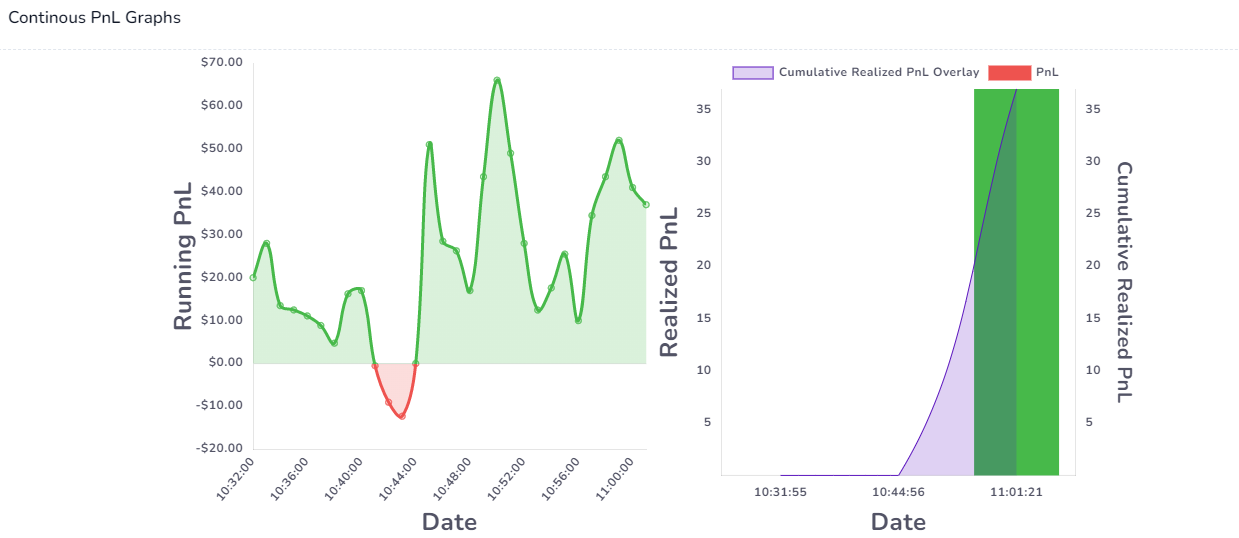
Shown below is simple AAPL trade:

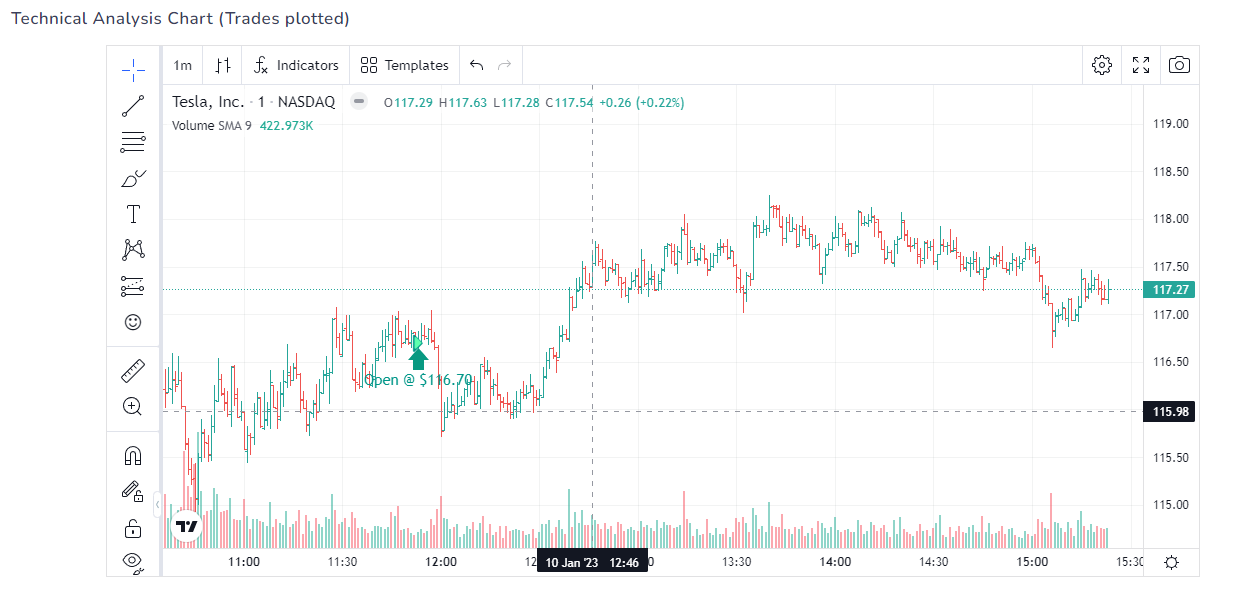
This is the trades plotted technical analysis chart for the same trade:

Now we have the continuous pnl charts. On the left is the continuous pnl chart throughout the trade and on the right is the chart with realized PnL as bars and the purple line/overlay as the cumulative PnL throughout the trade.

You will notice that the continuous chart shows much more detail than the realized PnL chart and it's often very useful to compare the two charts side by side.
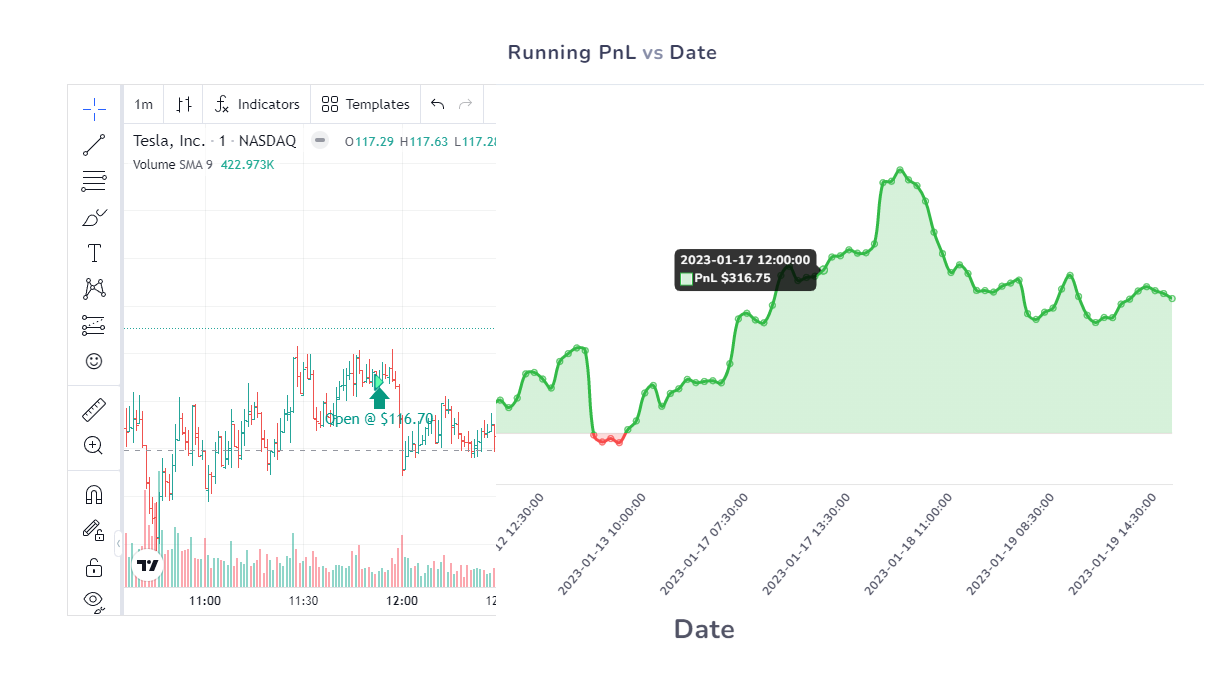
Now let's take an example of an open trade. The TSLA trade shown below was opened at around Jan 10th, 2023 11:30 AM ET.

The chart below (found at the bottom of the trade explore page) now shows the FULL unrealized PnL chart from the entry till the current date which at the time of writing this post is around Jan 18th, 2023.

This works for all futures, stocks, US options, indices-based CFDs/options, forex, and crypto trades. These charts along with MFE/MAE stats/charts are helpful in visualizing how much risk you are taking per trade. The unrealized chart can also be correlated with the Exit analysis charts to realize when you should be taking profits and when you should wait it out.
For options traders, we have a completely dedicated tab to do these types of visualizations that we recently introduced. Instead of these unrealized charts, you can click on "View options chart" at the top of the trade explore page, and your entire trade will be copied to the options simulation page where you can view your cumulative position's PnL and also each options leg/contract OHLC chart.

More info on this options simulation feature can be found here: https://tradesviz.com/blog/options-execution-simulation/
We want to provide traders of all asset types with a complete analysis of their trades - during trading and after trading. These charts will surely help you improve your trade management skills in a visual way.
As always, if you think this can be improved or extended, or if you have any other feature requests, please do let us know! We are always listening to your feedback to make TradesViz the best trading journal for YOU!
Update Aug 8th, 2023
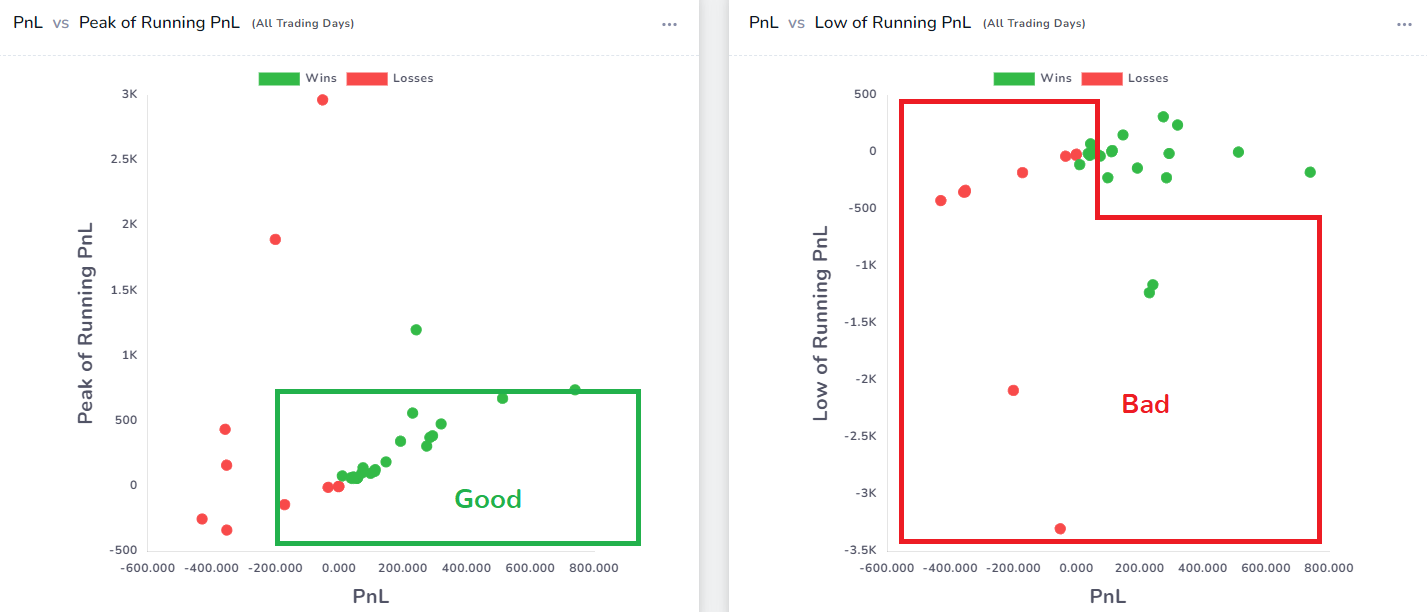
You can now view running PnL as various statistics for each trade.

