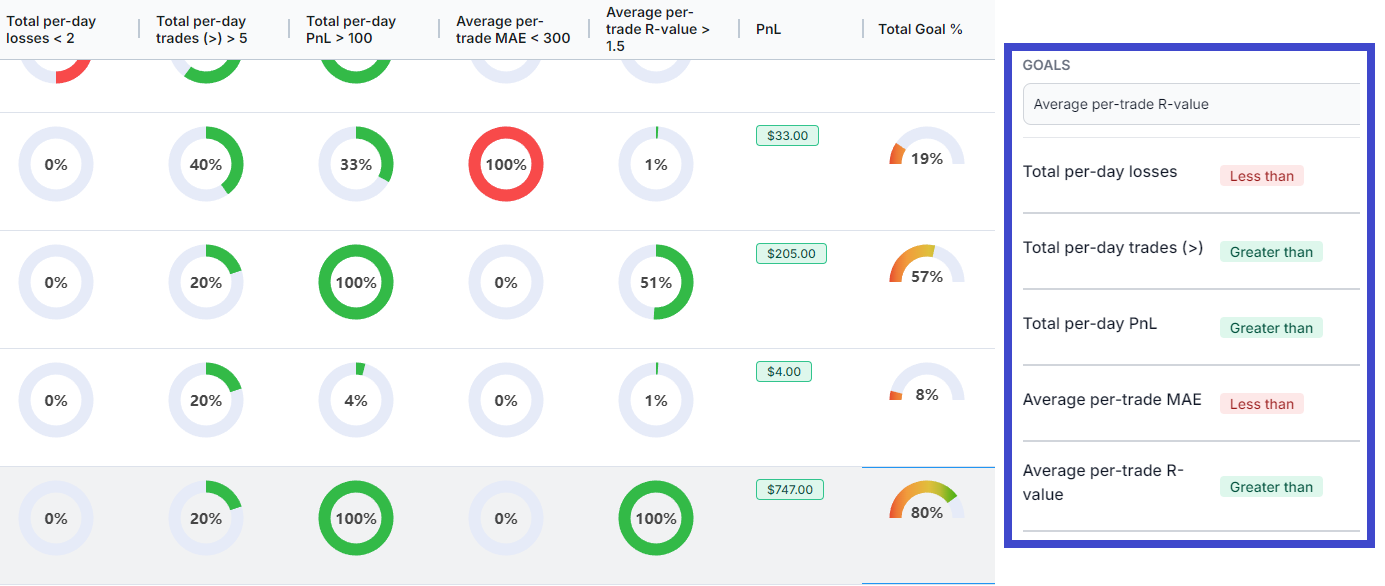
This is the next frontier of tracking in TradesViz - Goals.
Today, we introduce 100% automated goal tracking and visualization on the TradesViz trading journal. This is the first time any online trading journal has had fully automated, 100% custom goal tracking across any no. of trades, accounts, and multiple timeframes.
Before we dive in, what are trading goals?
It's subjective. For some, it's just profit and loss, for some, it's win rate, for others, it's a combination of risk and reward, etc.,
Whatever it may be, a goal achieved is when the criteria you define are met. For example, if your goal is to make $100 every day then the sum of the total pnl of all trades made that day should be greater than or equal to $100 for you to reach your goal on any given day.
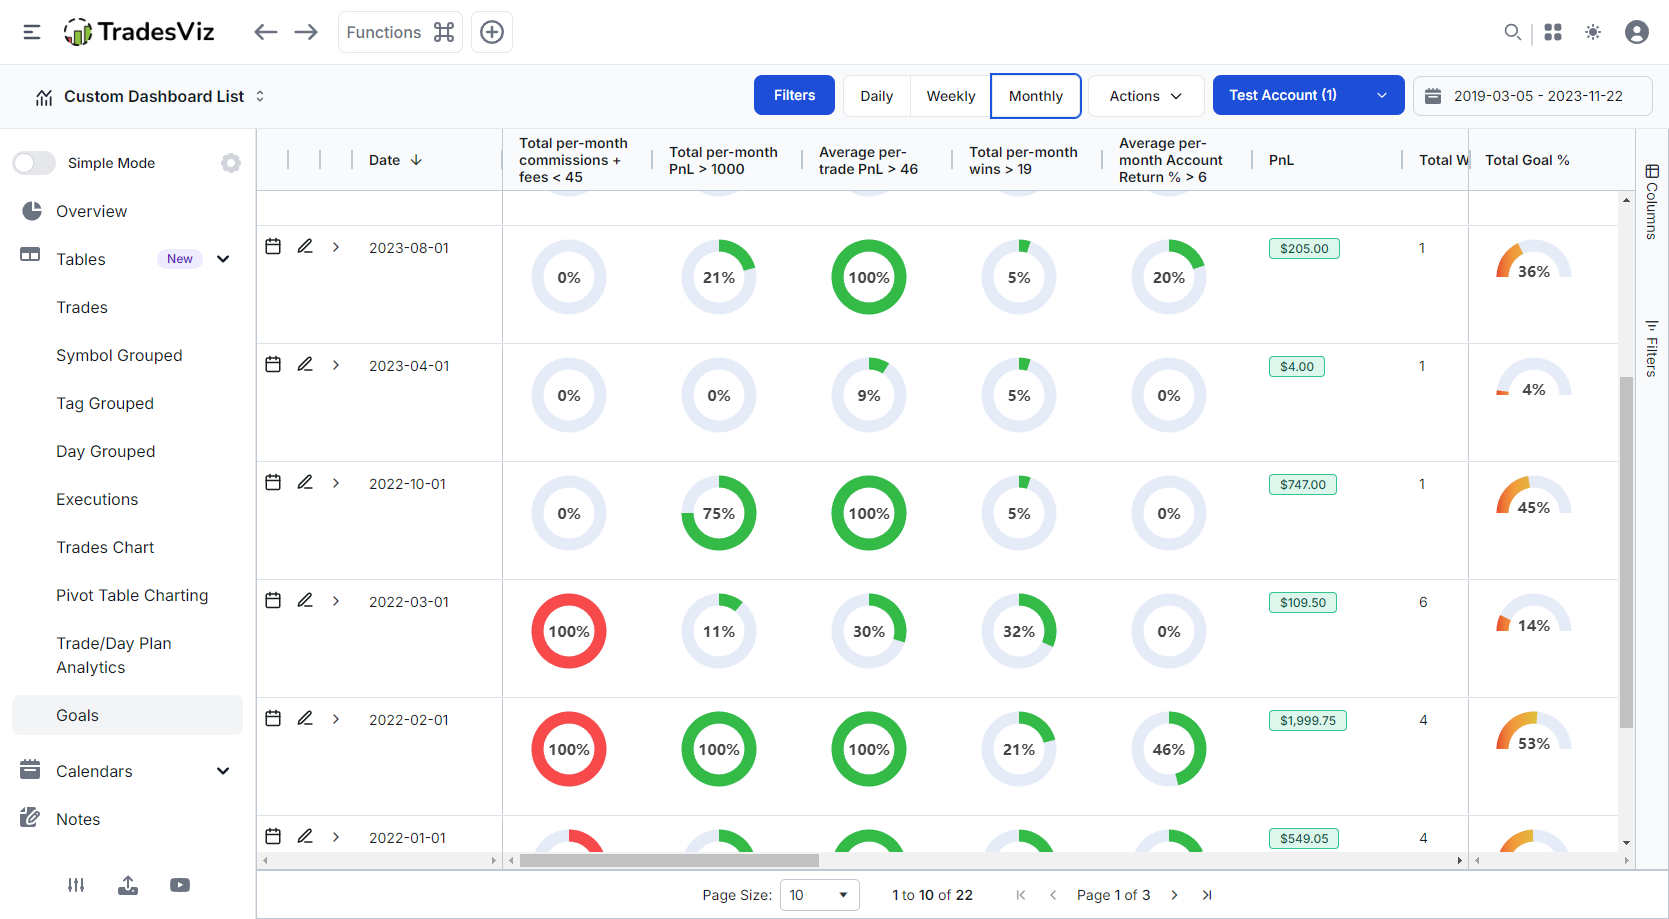
You can access the new Goals table within the "Tables" section. Here's how it looks:
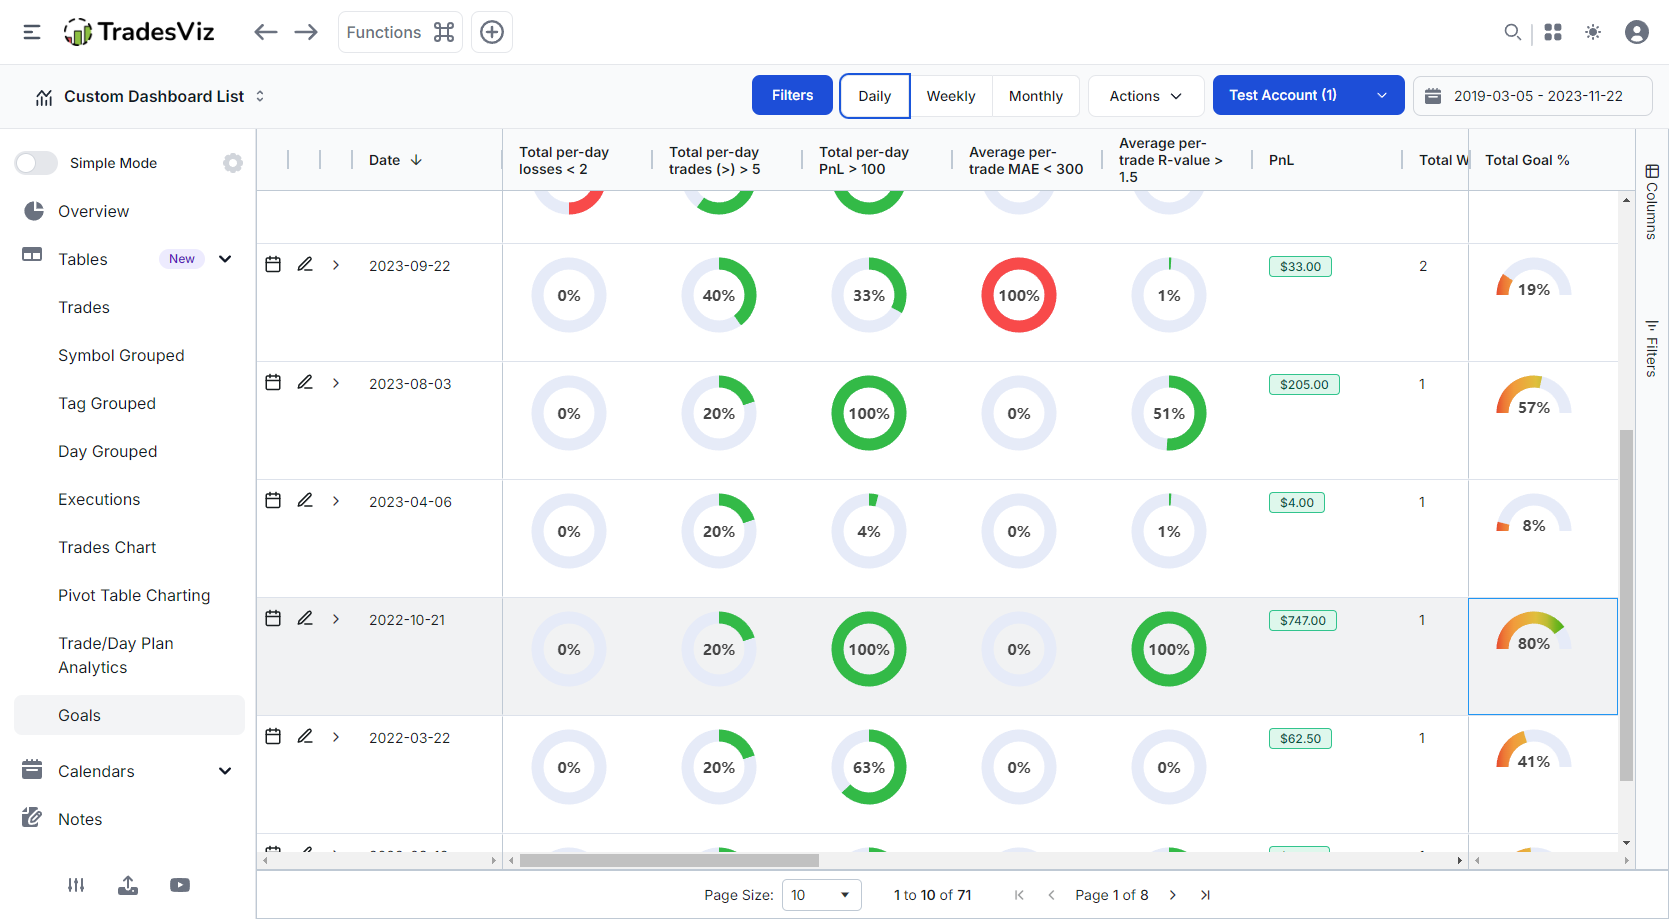
Here's the breakdown of the table UI:
- The table has 2 pinned sections. The left section contains the shortcut to edit/view/expand the day and also the date itself (sortable and filterable). The right-most column is also pinned and this is the total goal % that's calculated (signed average of all individual %)of the goals for that row.
- You can scroll left and right between these two rows to view all the columns that you will find in the normal day-grouped table. This includes pnl, commissions, total trades, etc., for the selected grouping (day, week, month).
- Remember that this is, like any other grid on TradesViz, 100% customizable. You can arrange, resize, or hide columns and save the table's state by clicking on actions > save state.
- You can switch between day, weekly, or monthly views at the top.
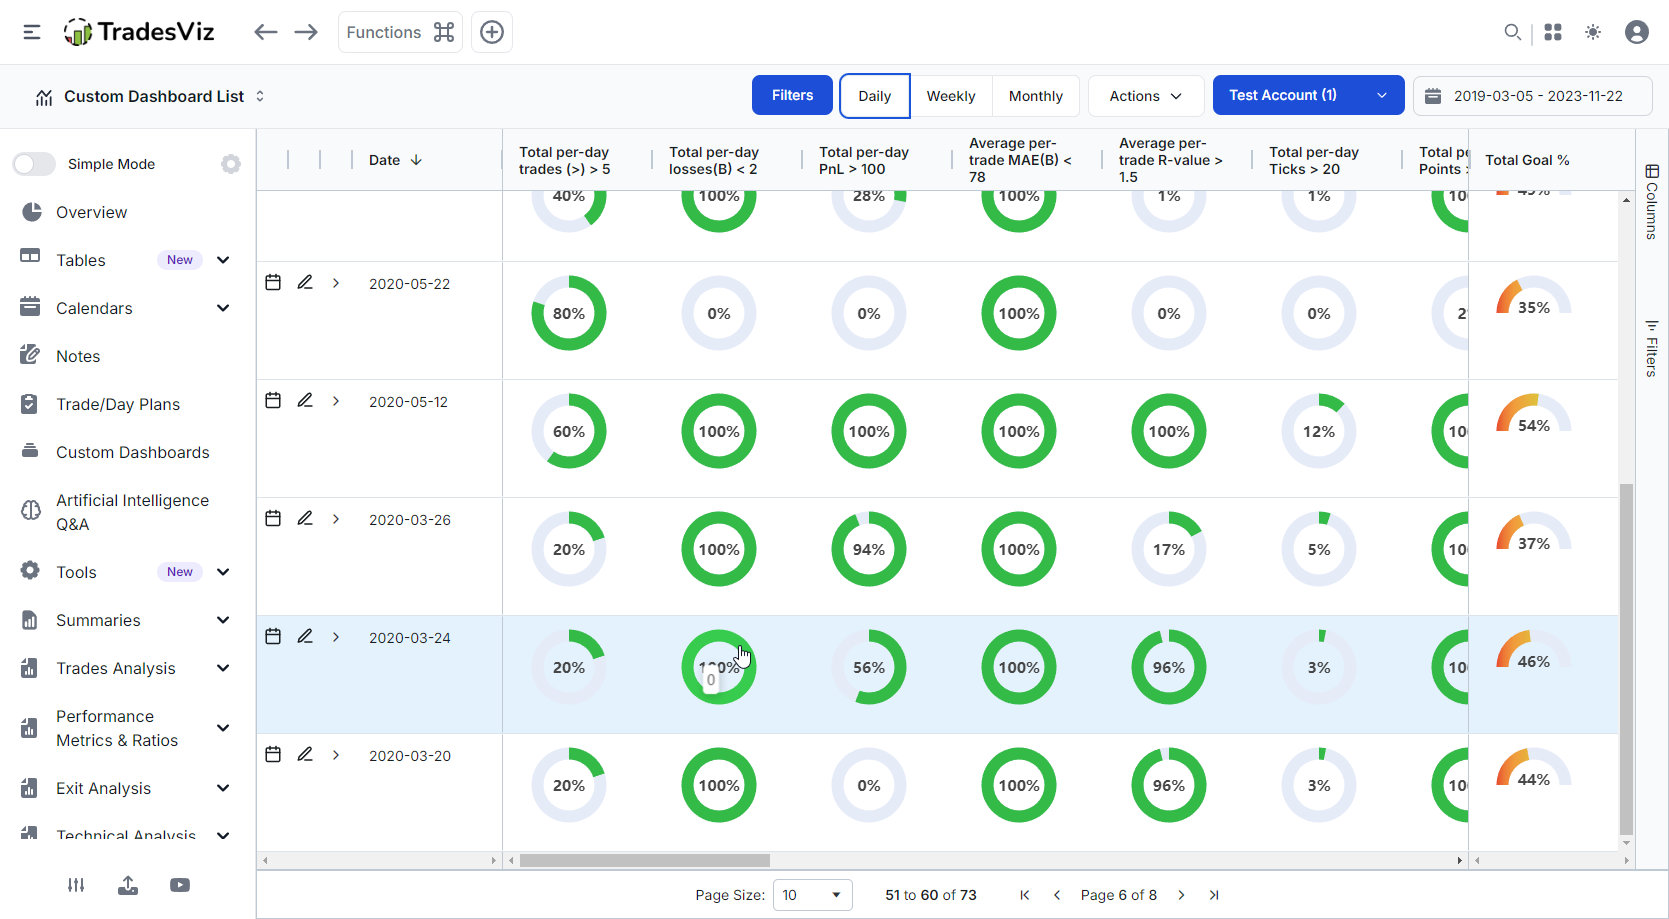
Now what do the gauges in each column represent? The % of goal you have reached for that particular condition.
In the above screenshot, you will see goal definitions as the column headers:
- Total per-day losses < 2
- Total per-day trades > 5
- Total per-day PnL > 100
etc.,
These are all custom. Where do we define this? it's in the account settings. A shortcut has been added to the '+' dropdown and also to the "Actions" button when the goals table is viewed. In the account settings page, you will see a new section for defining goals for each day, week, and month.

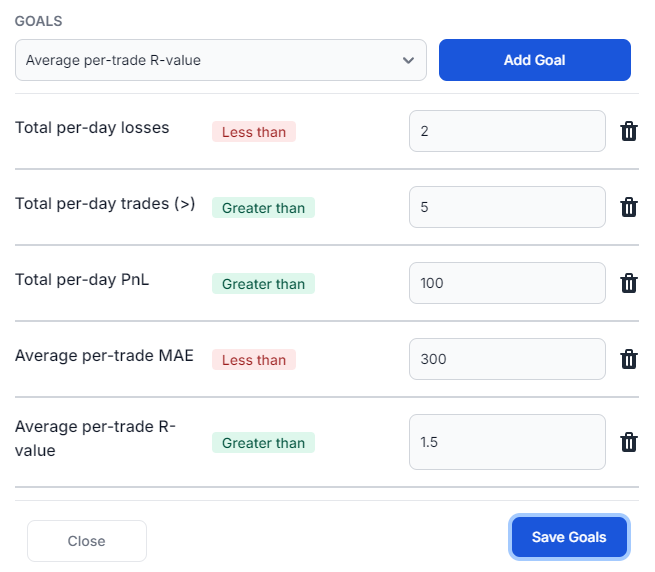
Click on any one of the manage buttons and start defining your goals. The rest is all automated.
 |
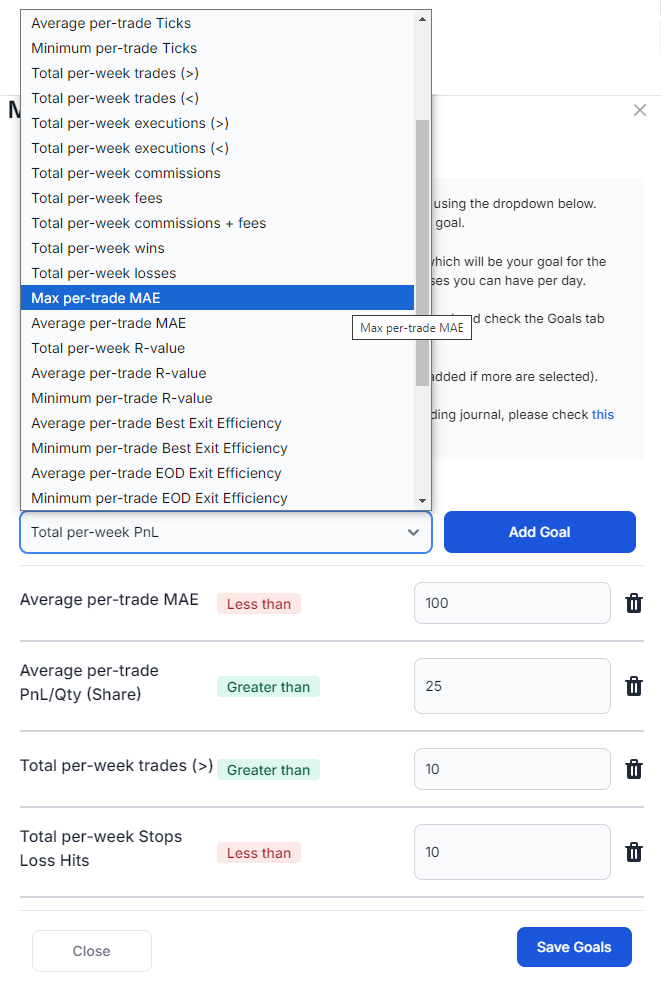 |
Select from any of the 30+ goals and click on "Add goal". Once added, you will see the goal, the goal's condition (greater than or less than), and input for the numeric condition that satisfies the goal criteria. The goals with "less than" conditions are the ones you ideally want to minimize - like total commissions, total losses, max risk (MAE), etc., whereas the goals with "greater than" conditions are the ones you want to maximize - like total pnl, wins, exit efficiency, etc., You may see some conditions have both variants - like total trades - this is so that you can set a goal both ways. For example, some traders may want to make at least 5 trades or some may want to limit to 7 trades per day. We want to accommodate as many conditions and scenarios as possible here.
Similar to this, the gauges are also color-coded. The goals with the "greater than" condition are in green and the goals with the "lesser than" condition are in red. When adding up the total %, we use the negative part of the "lesser than" gauge to signify how much you've avoided the negative limit.
Once you've added your goals and the numeric conditions, click save goals and visit your goals table. You should be able to see all the goal gauges for the timeframe you've defined the goals for.
Note that your daily goals need not be the same as the weekly or monthly.
You have 30+ conditions to choose them. As a trader, it's your task to choose your goals appropriately based on your experience level, requirements, market conditions, account size, etc.,
We are open to taking feedback and feature requests to add more goals/conditions.
You tell us what you want to track and we will add them.
Right now, our focus with this feature is to give traders a way to visualize their progress. While we have 100s of statistics, so far, we have not added any feature that says you've achieved a certain target. This is us filling that gap. A positive reinforcement for traders every day, a way to quickly figure out what to improve, what to focus on, on different timeframes.
Finally, remember that goal conditions are based on trade statistics. For example, without filling in stops or targets, you cannot effectively use risk-based or risk-distance-based goals. Without fees/commissions, you cannot use total commissions/fees target limit goals.
However, since you are on TradesViz, we've already considered all of this, and we just introduced fully automated target profiles this month.
- Fully automated target profiles: https://www.tradesviz.com/blog/advanced-targets-profiles/
- Fully automated commissions profiles: https://www.tradesviz.com/blog/advanced-commissions-profiles/
What's left?... Your csv/import or automated sync already brings in all the basic trade data like price, date/time, quantity, side, and symbol. From that, we group the executions into trades and then automatically generate advanced stats like MFE/MAE, best/EOD exit, relative volume, running pnl analysis, and a plethora of pnl stats. Combining these stats again with the targets (stop/profit), we get R-value, realized pnl, max risk, loss distance, and more stats - all 100% automated.
There isn't any journal in the world with this level of autonomy, detail, features, and carefully designed visualizations to make the most of your data. We live in an era where data is gold, and you must use it as much as you can to gain insights to get ahead.
We hope this feature and our reasoning behind it give you one reason why you should definitely start journaling your trades as soon as possible if you are not already doing it. Every day you don't check your journal is another day you risk making mistakes you will later regret.
Feb 2025 Update
Goals can now be normal/continuous or binary. Normal is the default where the % of goal is based on the ratio of target achieved/missed and binary goals are a simpler version of this: if the actual value is less than target condition in goals where "less than" is the condition, then the % is 100%. This is especially useful when you want to simplify some goals: like assuming the goal as reached when you have less than 5 losses - so in this case, the goal is 100% when you have 4 losses or 3 or 2 or 1.
You can now make any goal a binary goal via the same add goal popup box from the account settings as described in this blog post.

Example result:
Let the year 2025 be the year you set goals that you follow and consistently achieve them. Let 2025 be the year TradesViz helps you achieve those goals - step by step. We've got a lot of huge improvements coming in the following year. We hope for your continued support in the following year also! We will keep improving TradesViz to always be the go-to choice for anything related to trade journaling/analysis, goal tracking, and planning.
From the TradesViz team, we wish you a very happy New Year! 🎆🎉
