Another month and we have another important update for everyone.
This time, we went back to basics looking for features that will be beneficial for ALL traders. One common piece of info that every trader is familiar with is tags. While TradesViz does have the most advanced tagging features among any online trading journal, there does not seem to be a way to quickly and efficiently search for trades/tags and look at their performance besides looking at the charts.
It is possible to do advanced analysis with tags and tag groups using a pivot grid, but that still required a few more steps/clicks than we ideally wanted.
So we are introducing the tags table. A table that's very similar to the symbol grouped table, but for this, it's grouped by your tags. With this, we now have 5 base tables that are accessible by ALL trades and in our opinion complete a trading journal.
- Trades table: List of your trades (70+ stats)
- Symbol table: Stats of trades grouped by underlying (each row is one symbol)
- Day grouped table: Stats of trades grouped by symbol (each row is one day)
- Tag grouped table: Stats of trades grouped by tags (each row is one tag)
- Executions table: List of your executions (Remember: One or more executions make up a trade)
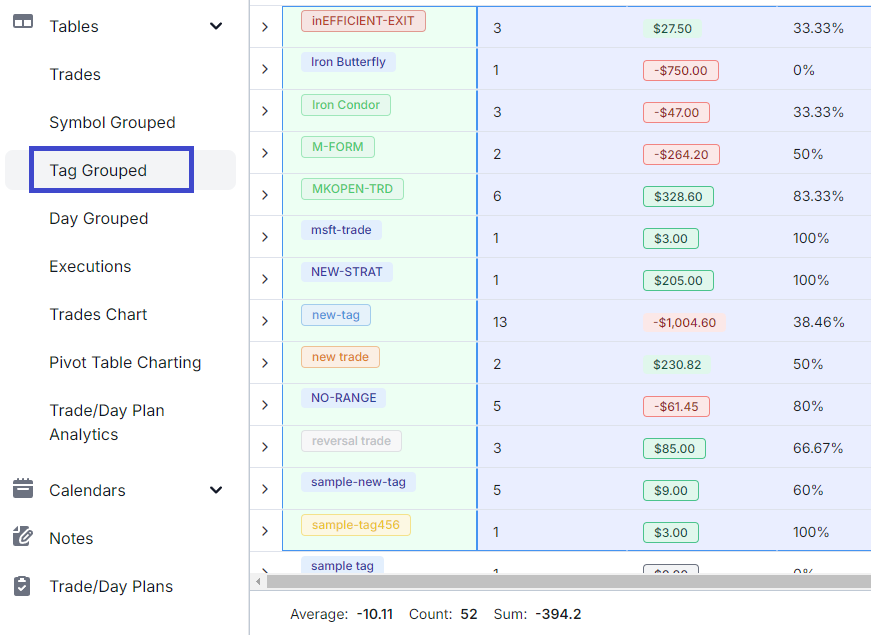
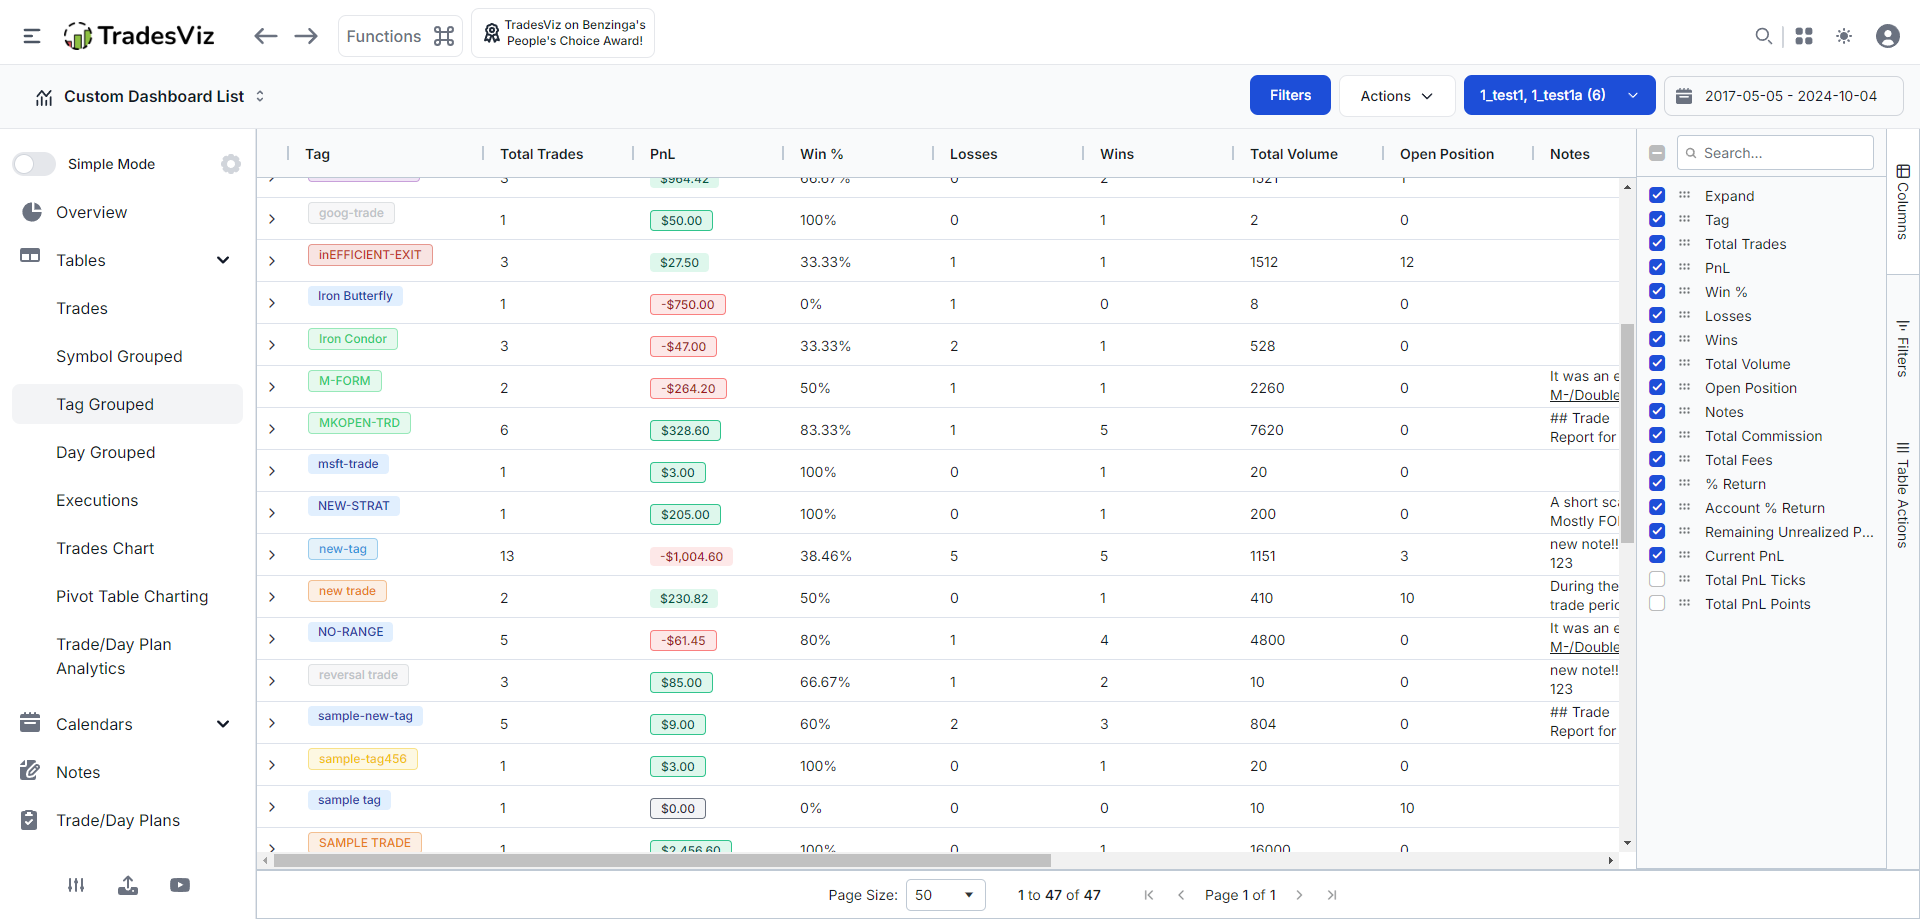
Below is how the tags grouped table looks like:
The tag grouped table tab is right under the tables section. In case you want to simplify the sidebar, you can customize it 100% with your own dropdowns using the gear button at the top right corner of the sidebar.
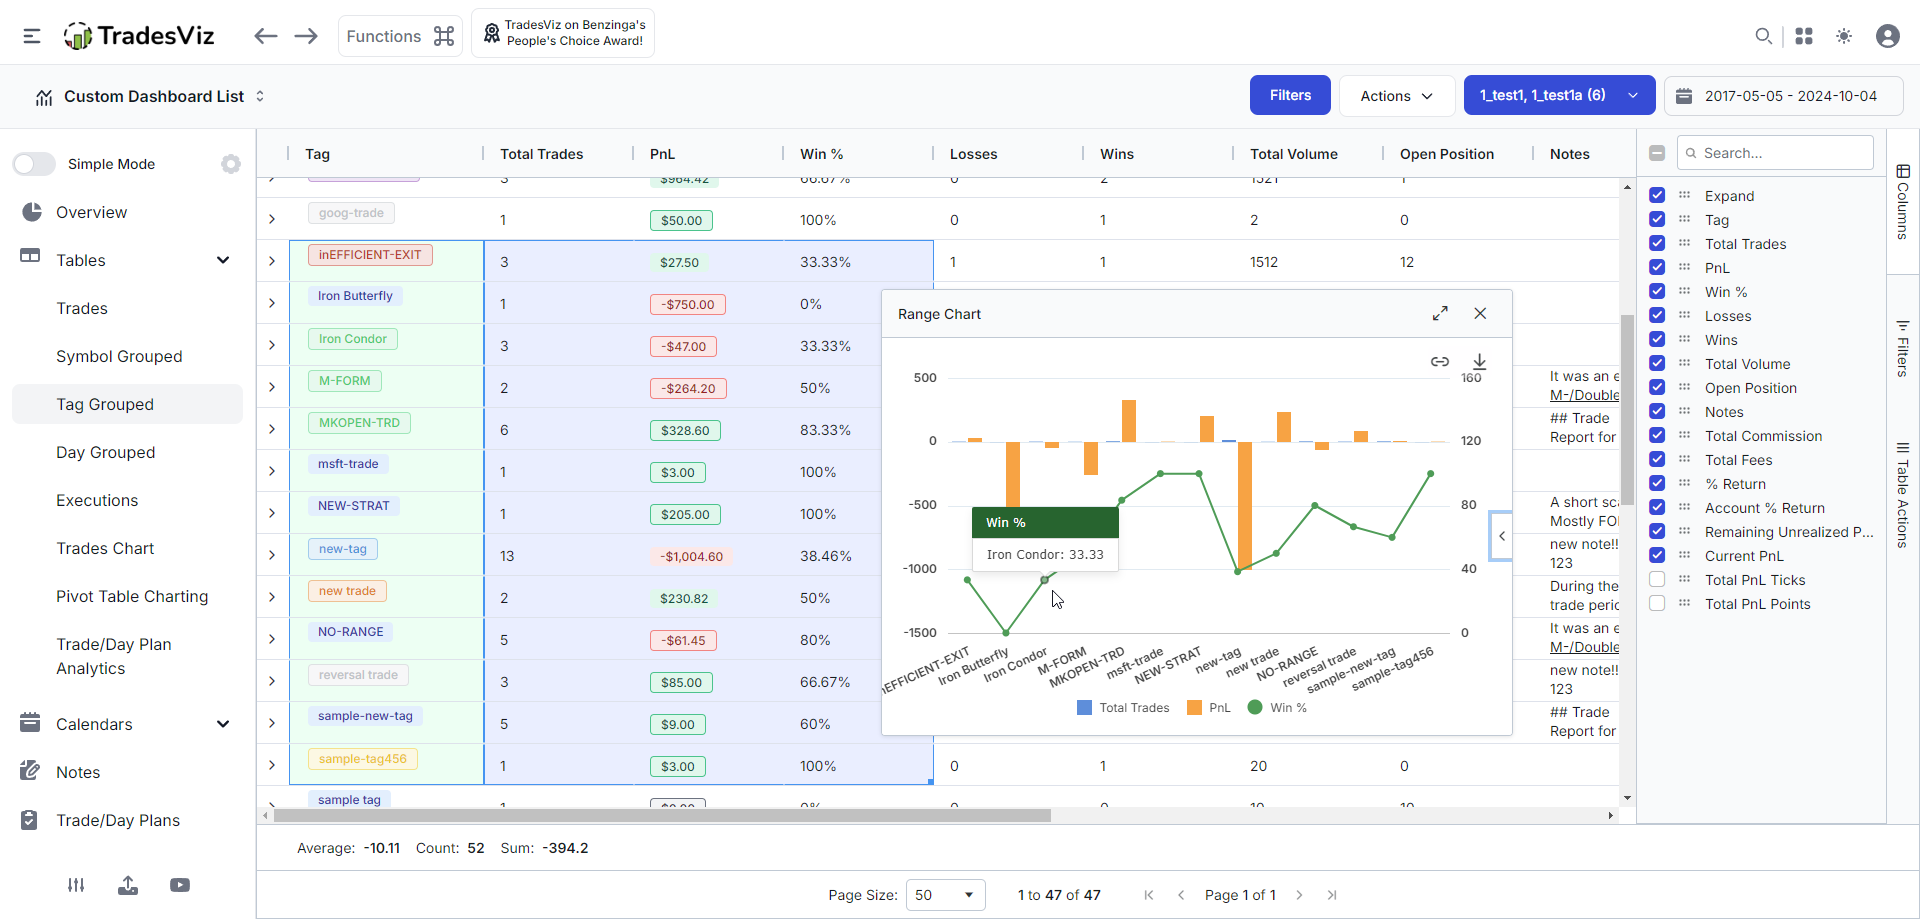
This table isn't different from any other table you've used so far - all the features like export, charting, dragging columns, sorting, cell selection, and more are available.
All the rows can be expanded to view what trades have a particular tag. Each tag will have a color that is dependent on the tag's tag group. If you have not used tag groups, all tags will be of the same color.
Here's a comprehensive guide to grid features on TradesViz: https://www.tradesviz.com/blog/grid-complete-guide/
Soon, this table will also be available as a table widget widget in the custom dashboard adding one more useful widget to your own custom home page!
This feature is available to all traders on TradesViz and so are basic tagging features. We hope this makes your trade anlaysis based on tags and strategies a bit more easier.
If you are looking for a more advanced grouping of tags including symbols and tag groups etc., please check out the pivot grid examples section which has many examples of how to do this.
We highly suggest using the built-in table filters and the charting tools to make the best out of the grids in TradesViz. These features add an extra dimension of insights to your analysis!
As always, please let us know your feedback by