An options flow dashboard, seasonality charts, SEC13F analysis, fundamental stats, trading simulators... and.. now an options payoff tool is also part of the TradesViz toolkit!
Options traders always need a lot of extra tools to understand the positions because of the sheer combinations of strategies that can be executed and how the market prices affect the options legs/strategies. We first introduced the options execution simulator/backtester to help traders understand the exact moves a complex option trade would make between a given date range in correlation with the underlying. While this has helped a lot of traders realize and learn from real-world examples, there was also demand for an idea that helped directly with planning the next day and our solution to that is the options payoff chart.
First, what is an options payoff (risk) graph? https://www.investopedia.com/trading/options-risk-graphs/
In simple terms (from Investopedia), it's
As this is mostly common knowledge among options traders, we will not delve further into how this works or about the inner workings fo the simulator. This blog will be focused on how to effectively use the options payoff/risk chart in TradesViz.
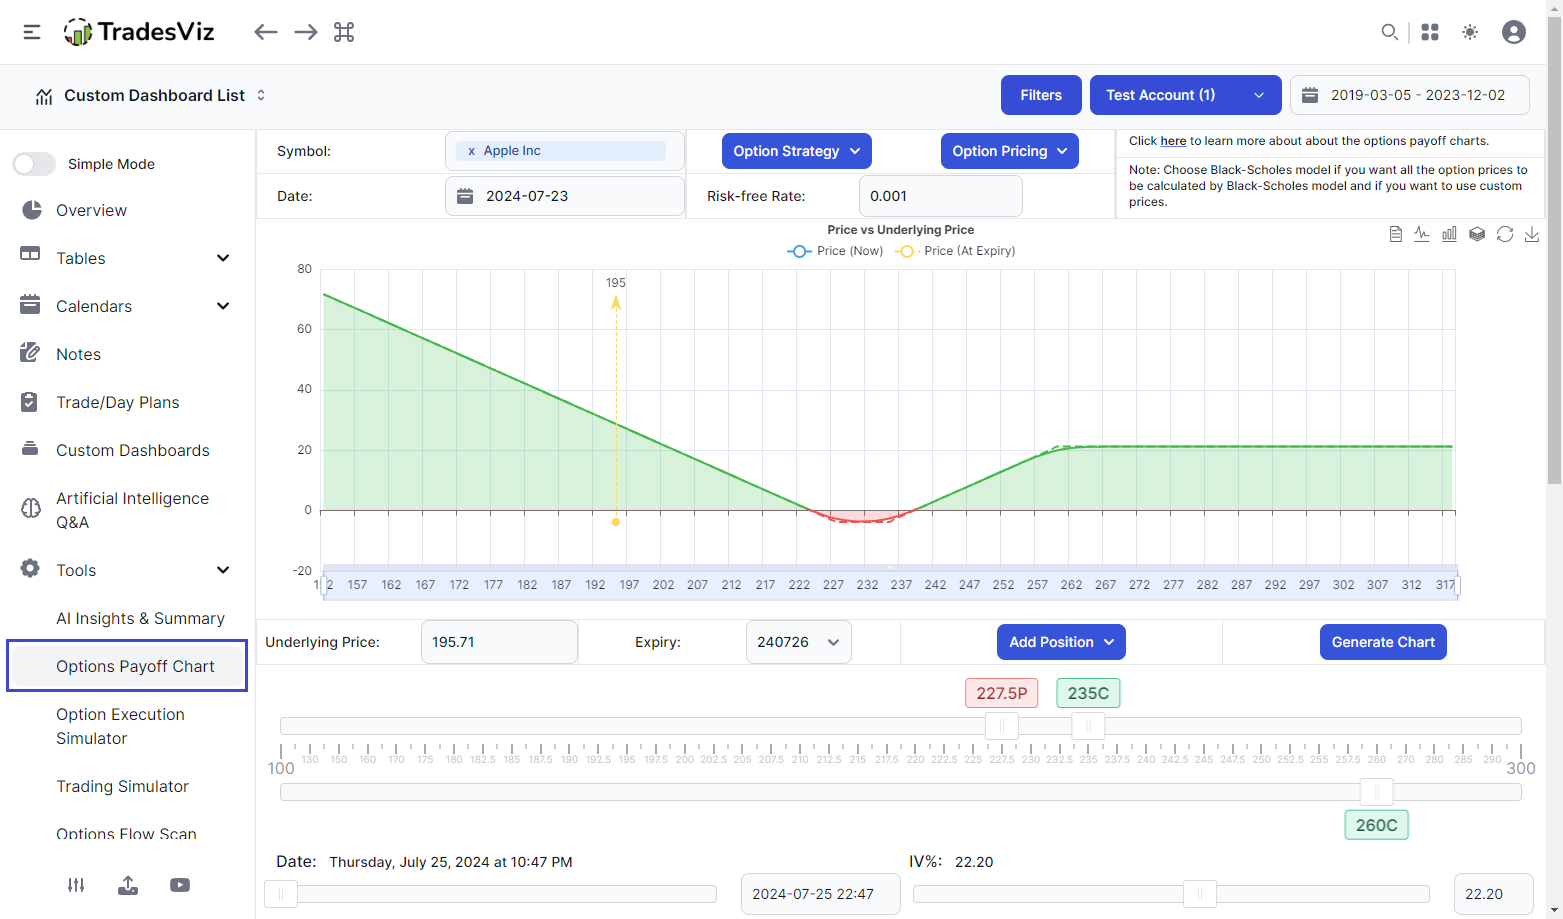
You can access the options payoff chart by clicking on "Options Payoff Chart" under the tools section in your main dashboard.
Once you are on the page, you will initially not see any charts because the symbol is empty.
Here are the basic operating steps:
1. First fill in your symbol (US equities, indices, NSE/BSE (IN) options are available). After a few seconds, a default options payoff chart will pop up with just a single call option added with tripe near the last EOD's underlying price. A video is shown below demonstrating this:
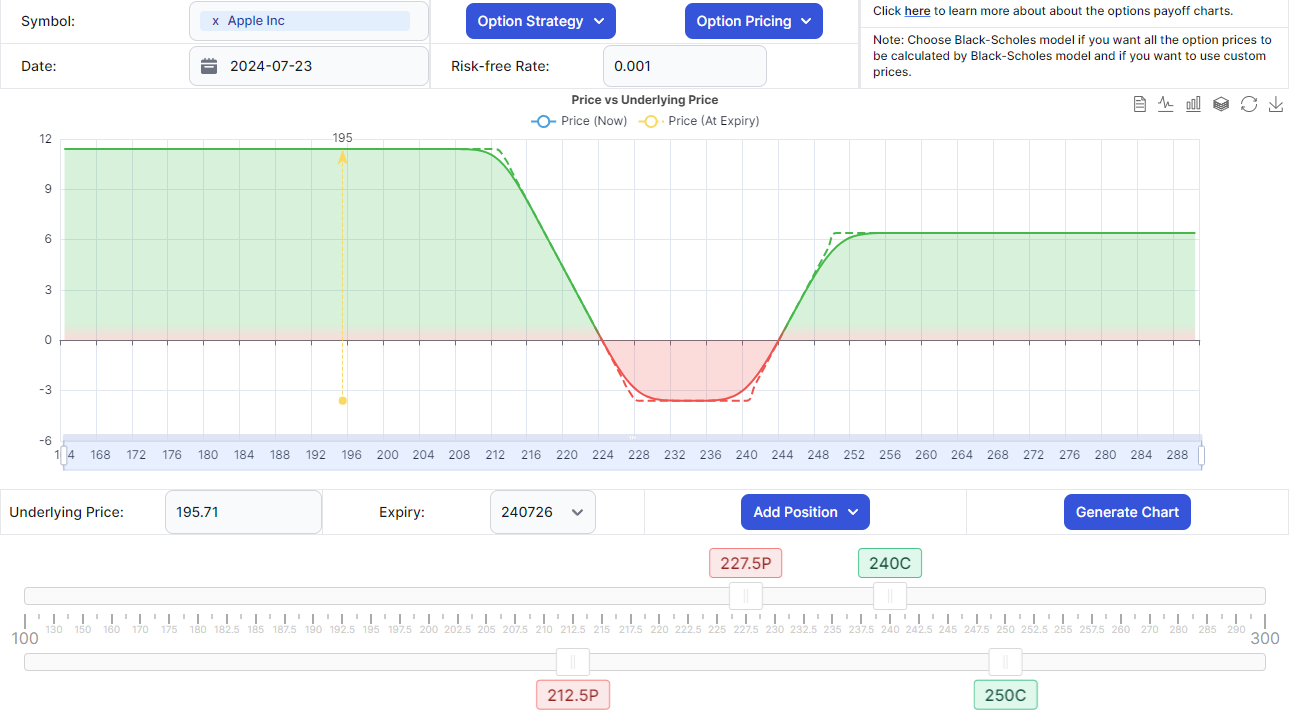
2. We will now look at the elements at the *bottom* of the chart. Here are the controls you have available to modify the chart:
- Underlying price: Automatically filled in after selecting the symbol, but can be edited. Editing this will change/affect the options payoff chart. You will see a yellow line marking the underlying price in the chart.
- Expiry: A dropdown of ALL expires based on OPRA data of the last trading day. Calendar spreads are also supported and you can easily see/track the different legs and change expires using the option legs table at the bottom of these controls (which we will explore further in later sections of the blog post).
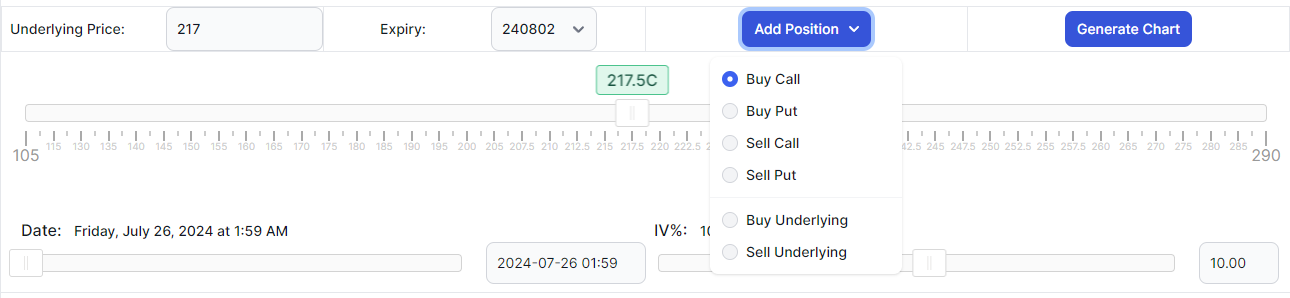
- Add position dropdown: This is used to add options/underlying legs to your strategy/simulation.
- Buy/long Call
- Buy/long Put
- Sell/short Call
- Sell/shot Put
- Buy/long underlying
- Sell/short underlying
- Generate chart button: Click on this button if you don't see any chart. Mostly not needed because all the options will change/affect the chart in real time.
- Strike bars: By default, you will only see one slider which is for all *buy*/*long* positions. Once you add a short position, you will see another bar at the bottom.
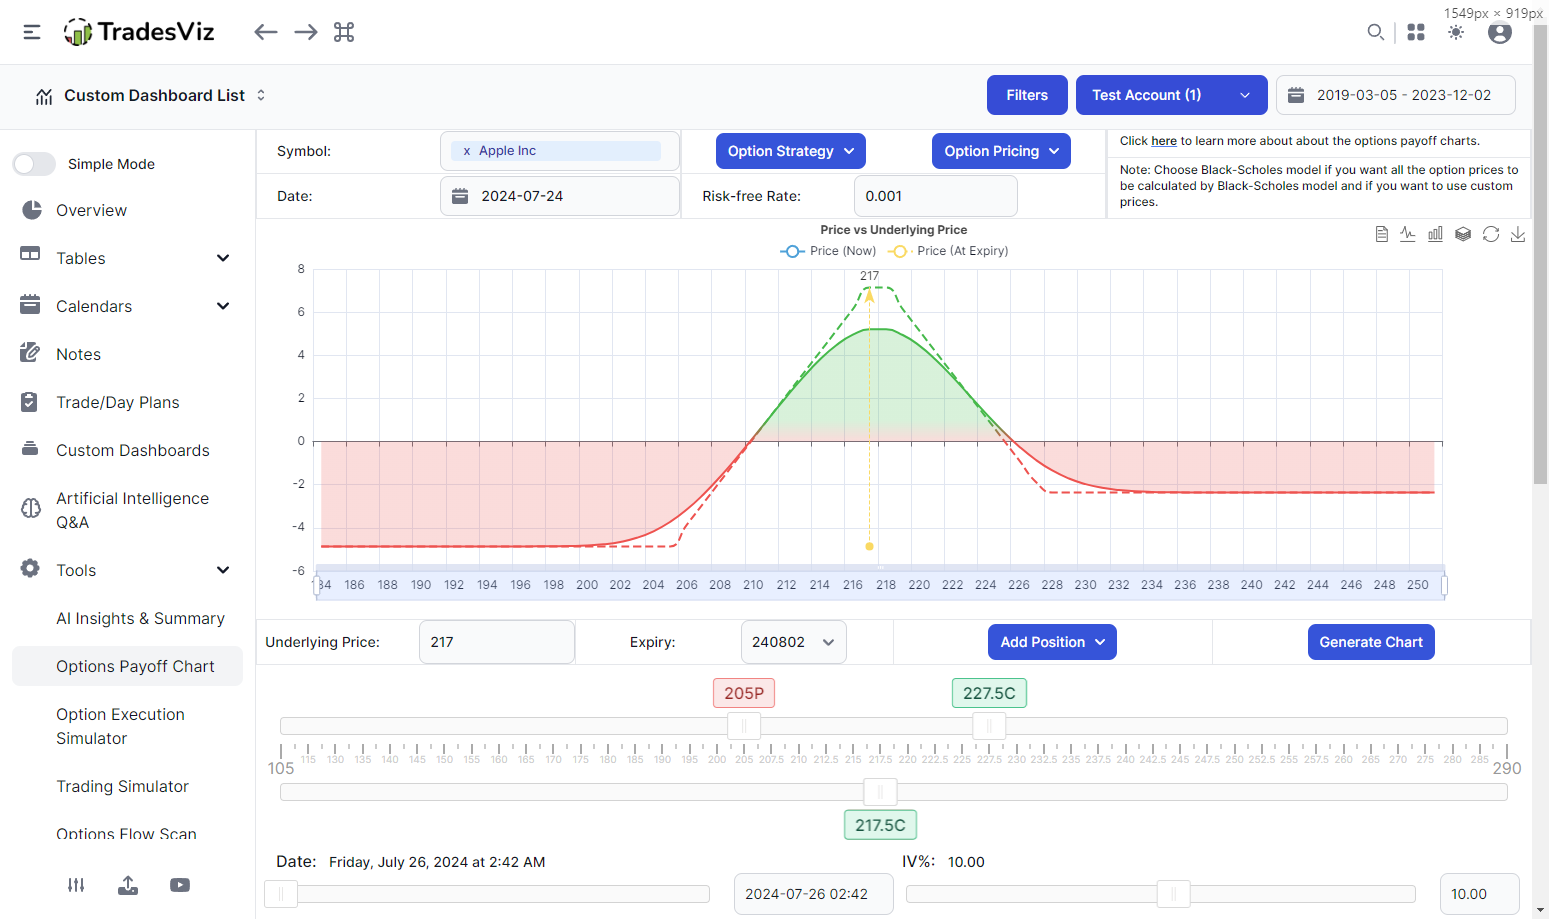
All the sliders in each of the slider bars are the strikes of the respective positions. They can be changed at any time by simply dragging and this change/affect the options payoff chart in real-time. The video below shows an example:
You can add many strikes and manage all of them either using the sliders or using the table at the bottom. Note that if you are adding option legs across different expires, that will currently not be indicated in the bar and instead will be shown as a row having different expiry in the options legs table below this section.
- DTE slider: You can use this slider or the date selector (by clicking on the date input) to simulate how the pricing will look at different dates of expiry. The options chart - like all other options, will update in real time.
- IV slider: This value will be assumed as the IV for all option legs and will be used for pricing calculation. Changing this will have a significant effect on the options payoff chart.
Next, we have the table of the option legs which again has a lot of utility in terms of modifying the data.
Remember that the table is synced with the sliders at the top and the chart is synced with the sliders. So changing the sliders will affect the table and vice versa. The end effect is the chart will be affected by modifying either the sliders or the table. The video below shows how changing the chart values affects the strike price sliders and the chart.
The table is very important because it shows you the total cost of the entire position and also the individual and cumulative Greeks calculated using the Black-Scholes model (More info: https://www.investopedia.com/terms/b/blackscholes.asp).
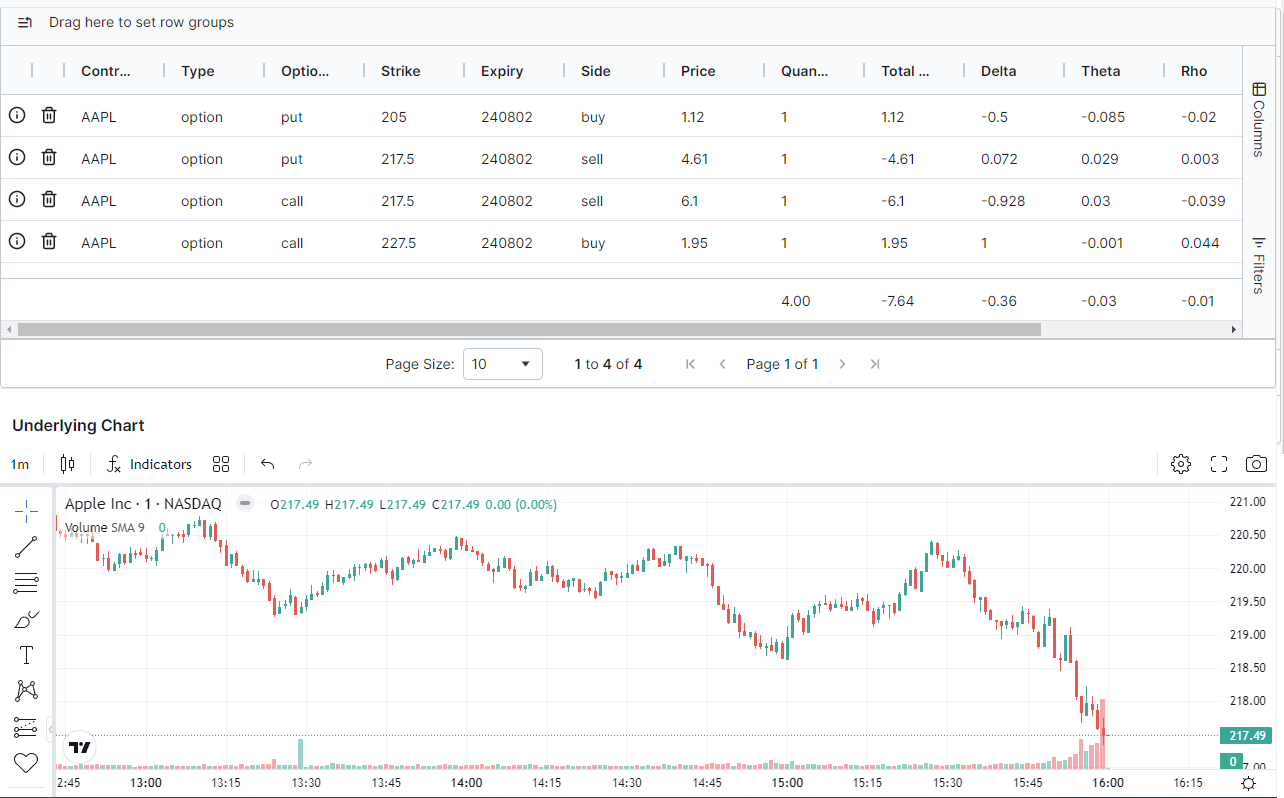
Like all other grids of TradesViz, you can drag to select, filter, sort, and group by row data! Double-clicking on any cell will allow you to change the value of the cell.
Right below the table, you will see an underlying chart of the asset you have selected at the top.
This ends all of the main options payoff functions available on TradesViz. In addition to the above, there are a few more components that the top that are worth exploring:
3. Global options
- Symbol: You can enter any optionable US symbol (stock, ETF, index) and also optionable symbols from NSE in India.
- Date: The simulation happens from this date. By default, it's set to the previous day. Remember that all the data we use is historical only and not live.
- Options strategy: We have nearly 40 strategies (more can be added on request) to choose from. Selecting any one will automatically erase all existing legs and will populate the option position with an example position of that strategy.
- Options pricing: This determines how the options pricing is calculated. By default, we use the exchange-provided data. But if you want to use Black-Scholes generated prices, that can also be selected. Note that it is also possible to edit the prices of any option legs via the option legs table described above.
- Risk-free rate: This is part of the Black-Scholes formula and typically suggested to leave this as 0.001.
This ends the complete walkthrough of the options pricing chart. You can use this to learn and build about options strategies and make notes of them in right within your TradesViz trading journal.
Update
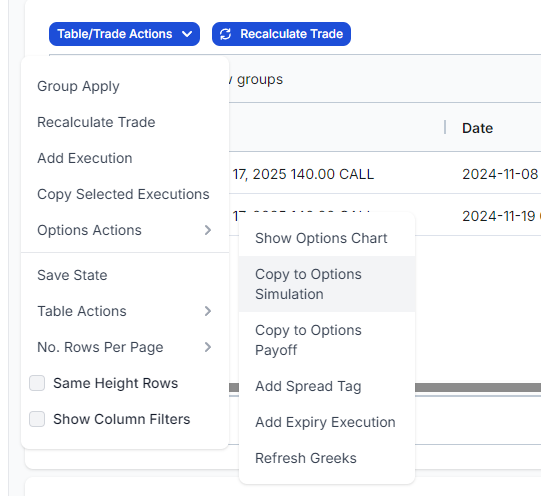
It is possible to copy your trade directly to the option payoff chart from the trade explore page. Explore your options trade, navigate to the executions table, and click on "Table action" > "Option actions" > "Copy to Options Payoff Chart".
We hope this becomes an important tool in your trading arsenal! We hope to add many such useful tools so that TradesViz becomes your go-to platform for everything trading-related!
Please let us know your suggestions and issues if you have any by emailing us at [email protected].