The requirement for trade journaling and advanced analytics tools among retail traders in India is rapidly growing. At TradesViz, while we started with support only for the US market, we later expanded to IN, AU, and CA exchanges and symbols with a lot of focus on Indian exchanges because of the high demand for them.
Today, we launch full support of options charting for Future/Index/Equity Options traded in NSE in India. This is the first time a trading journal has had full options charting support for Indian retail traders.
In Oct 2022, we first launched options charting for US stocks/indices and it turned out to be a game changer for options traders in the US. Being able to look at the actual option's OHLC along with the underlying gives you a much greater understanding of the trade. After all, most users do not even have access to or look at the actual OHLC charts of options when trading. Our goal is to help fill in this crucial missing piece in the post-trading - i.e., the journaling process so that traders are more aware of what trades they took and how the correlations between the options and the underlying work.
Here's an example of a BANKNIFTY options trade on TradesViz:
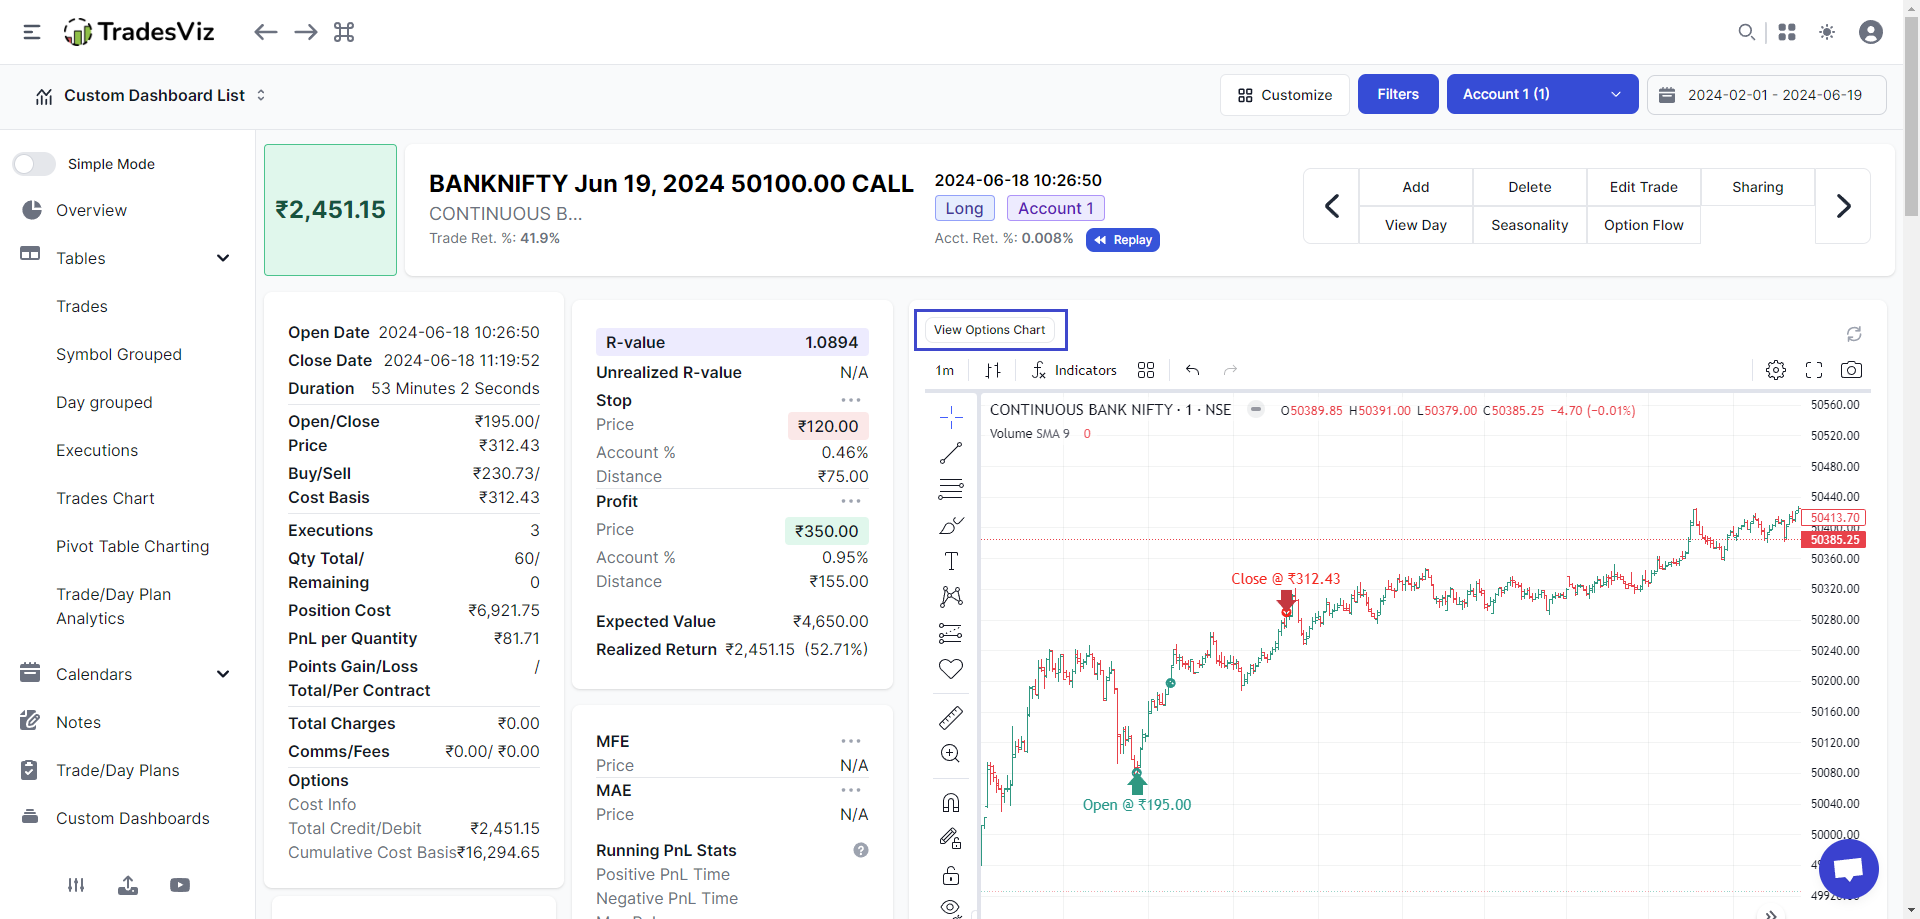
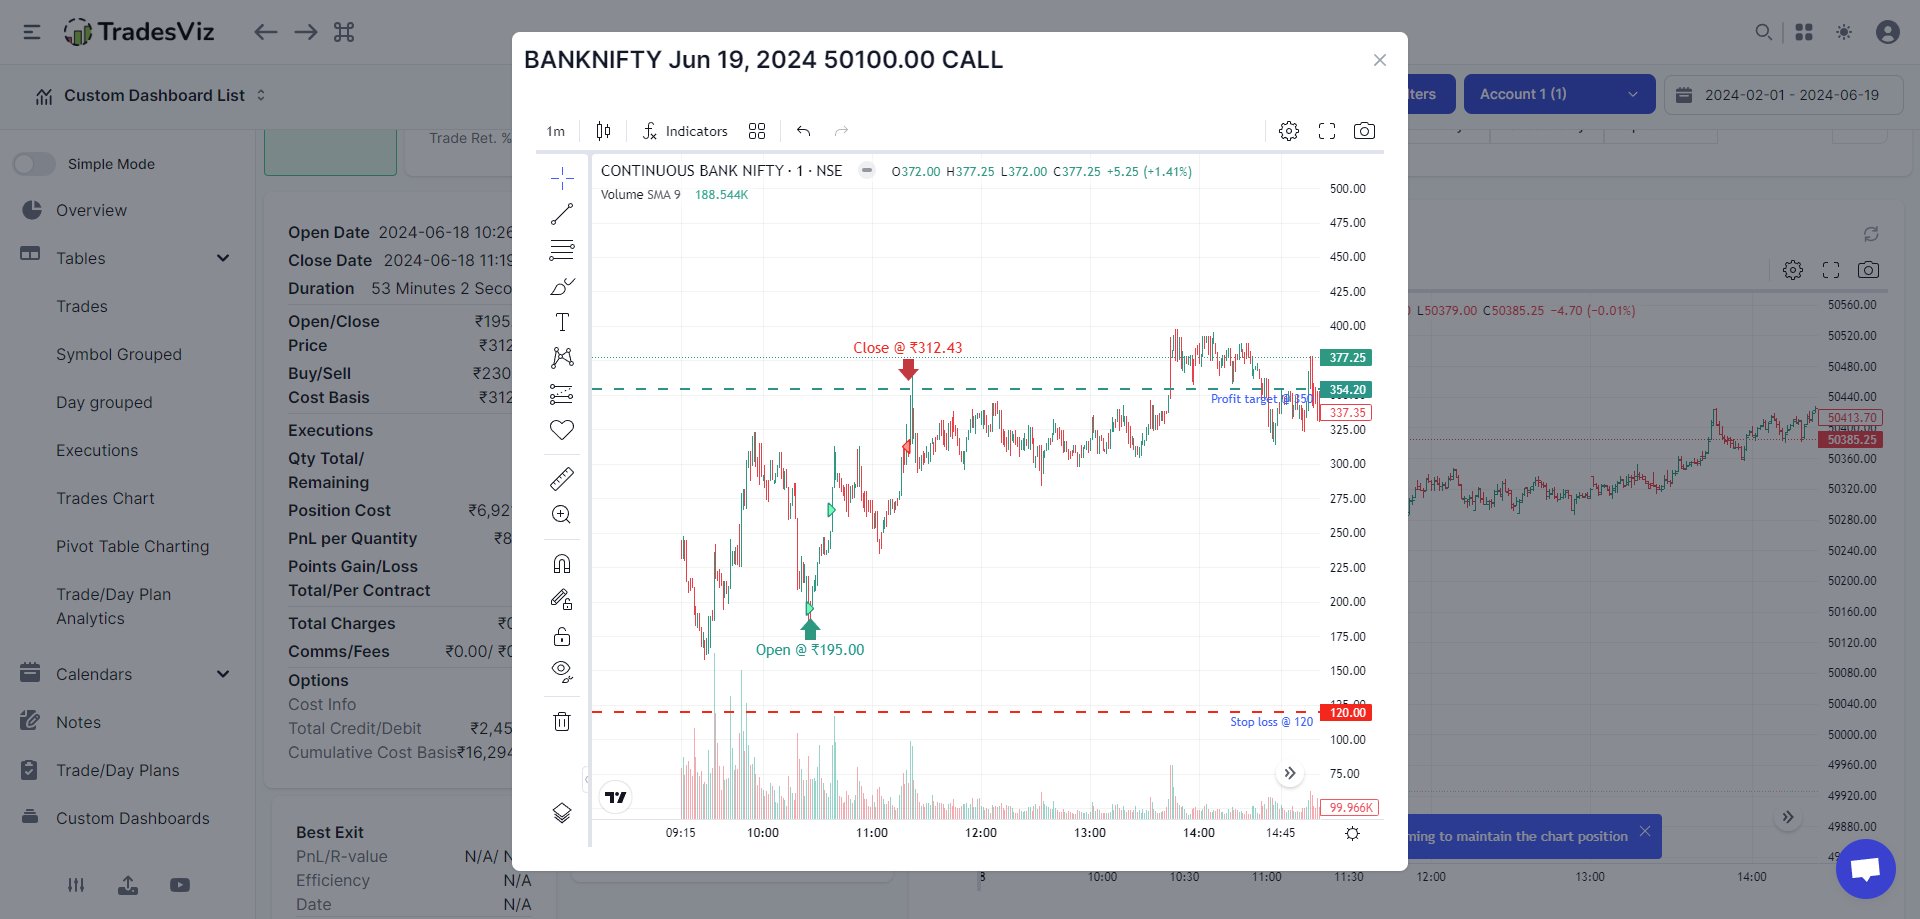
Starting today, when you click on the "View Options Chart", you will be able to see the actual options OHLC of this particular contract (in this case, BANKNIFTY Jun 19th, 2024 expiry 50100 CALL option).
Options volume of index contracts is crazy high compared to the US market so most of the charts traders on TradesViz will see for NSE options trades will be filled with insights and patterns that are extremely useful in learning how to time the entries, exits and also in learning about market movements under volatility.
We've long heard from Indian traders that our Platinum platform's options features are only for US market traders, but from now on, it changes. Almost all of our options features are also coming to traders trading on NSE.
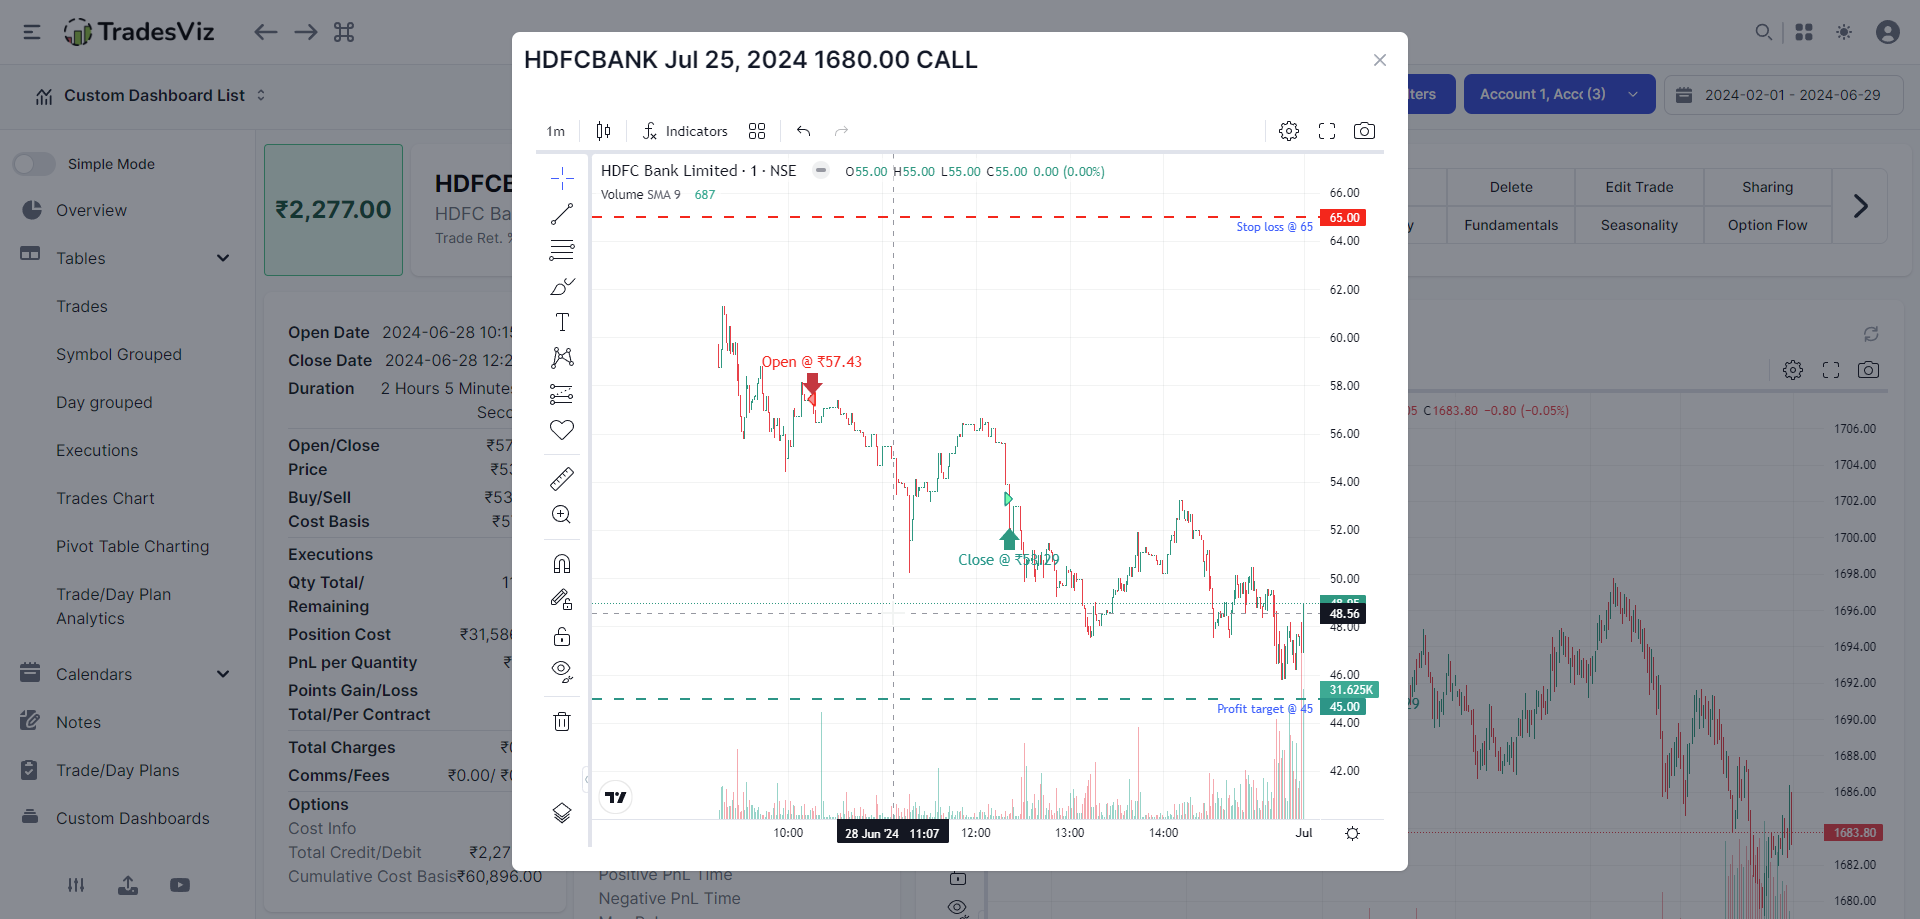
Here's another recent example of HDFC bank's trade explore along with the options chart.
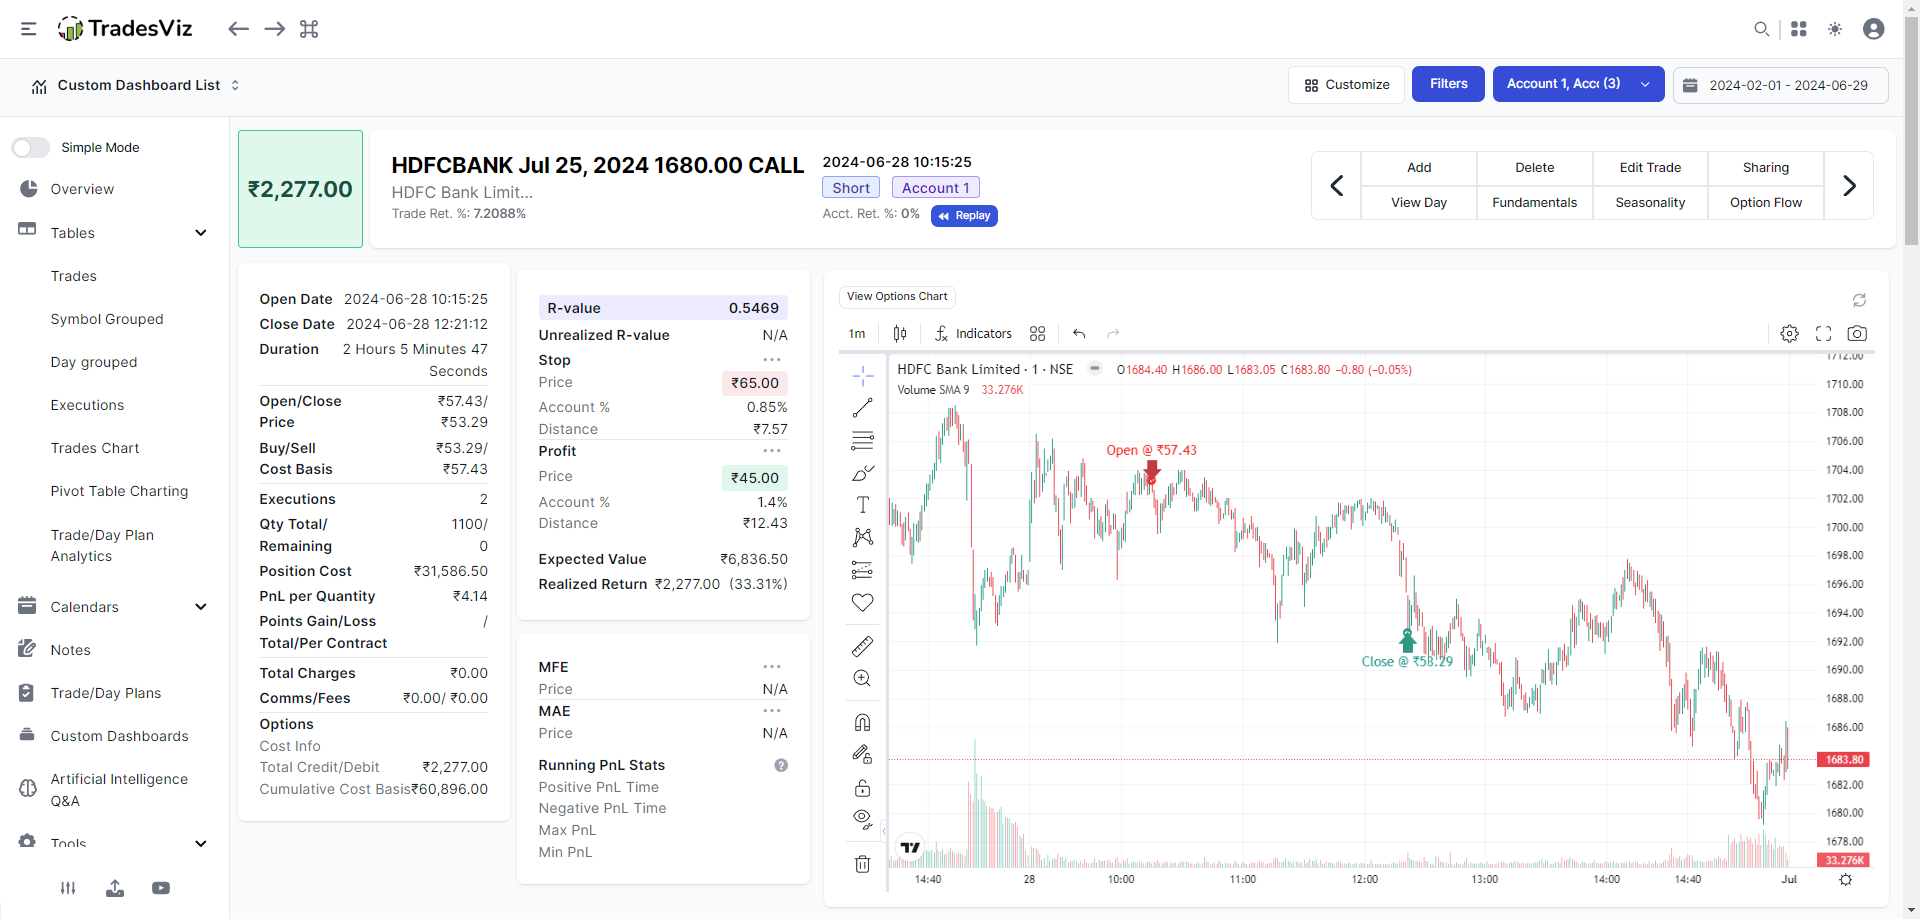
and here's the options chart for HDFC Jul 25th expiry 1680 call.
This is not all we're launching today.
Our popular options executions backtesting/simulation feature which has supported ALL US equity and index options is also getting support for NSE F&O symbols!
Launched in Jan 2023, so far, it has helped tens of thousands of traders better understand options strategies by simulating exactly how the pnl and pricing would change for single, and complex multi-leg positions historically.
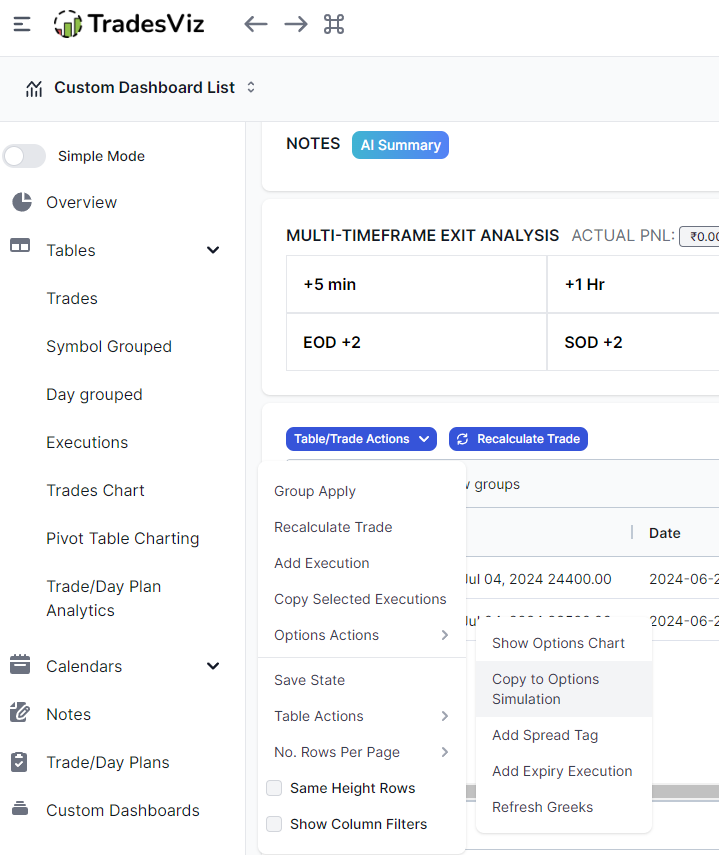
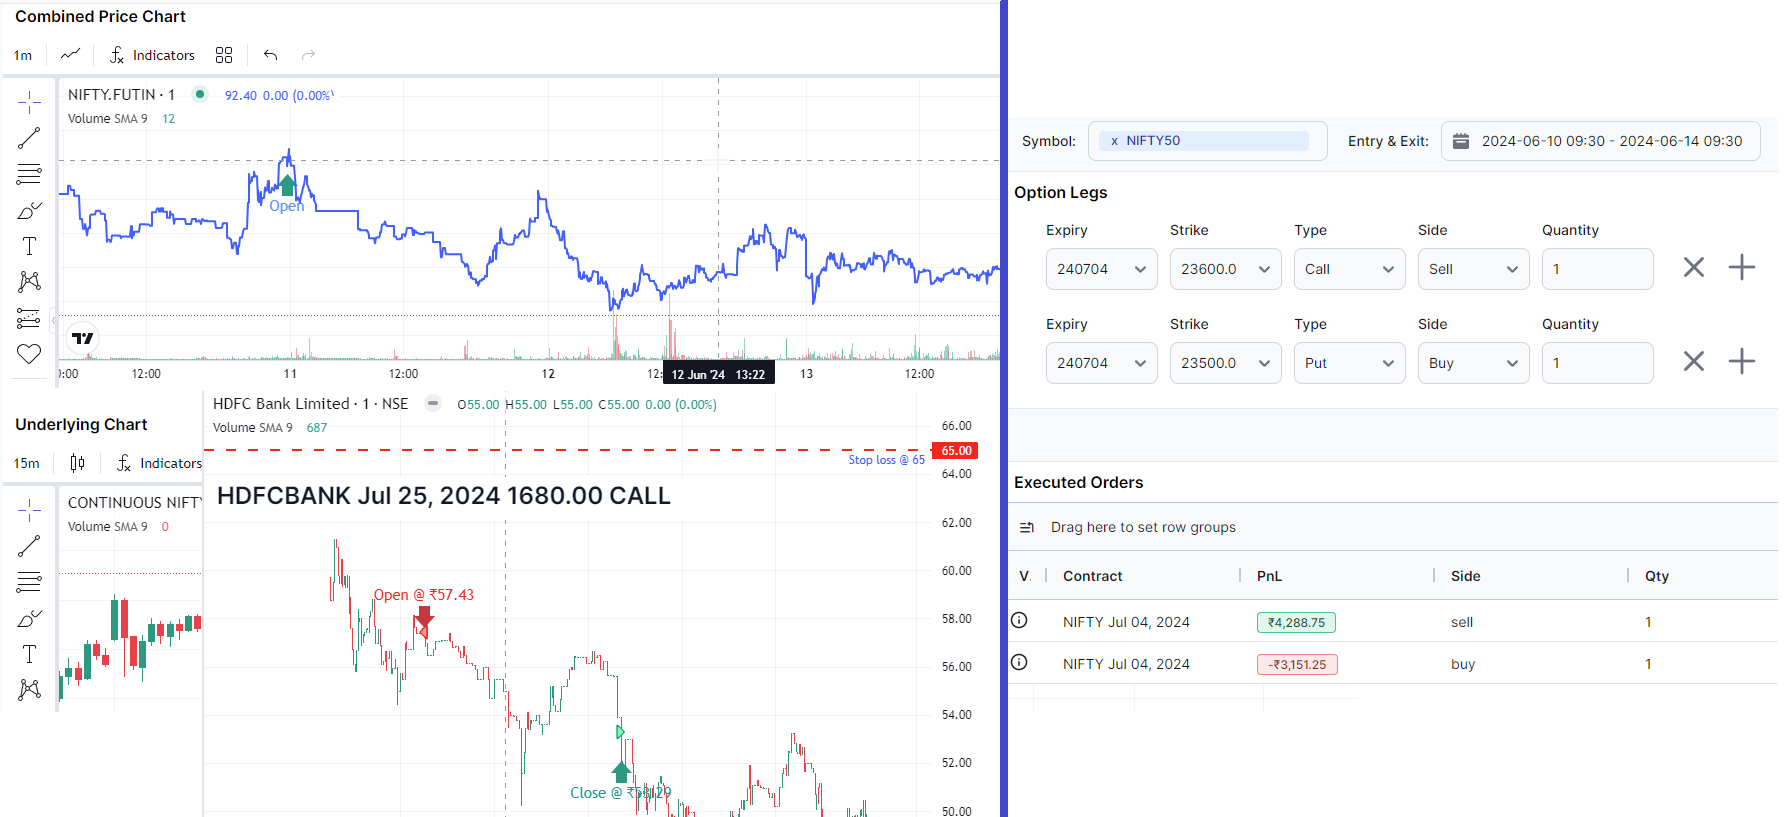
Here's a NIFTY50 multi-leg example in the options execution simulator:

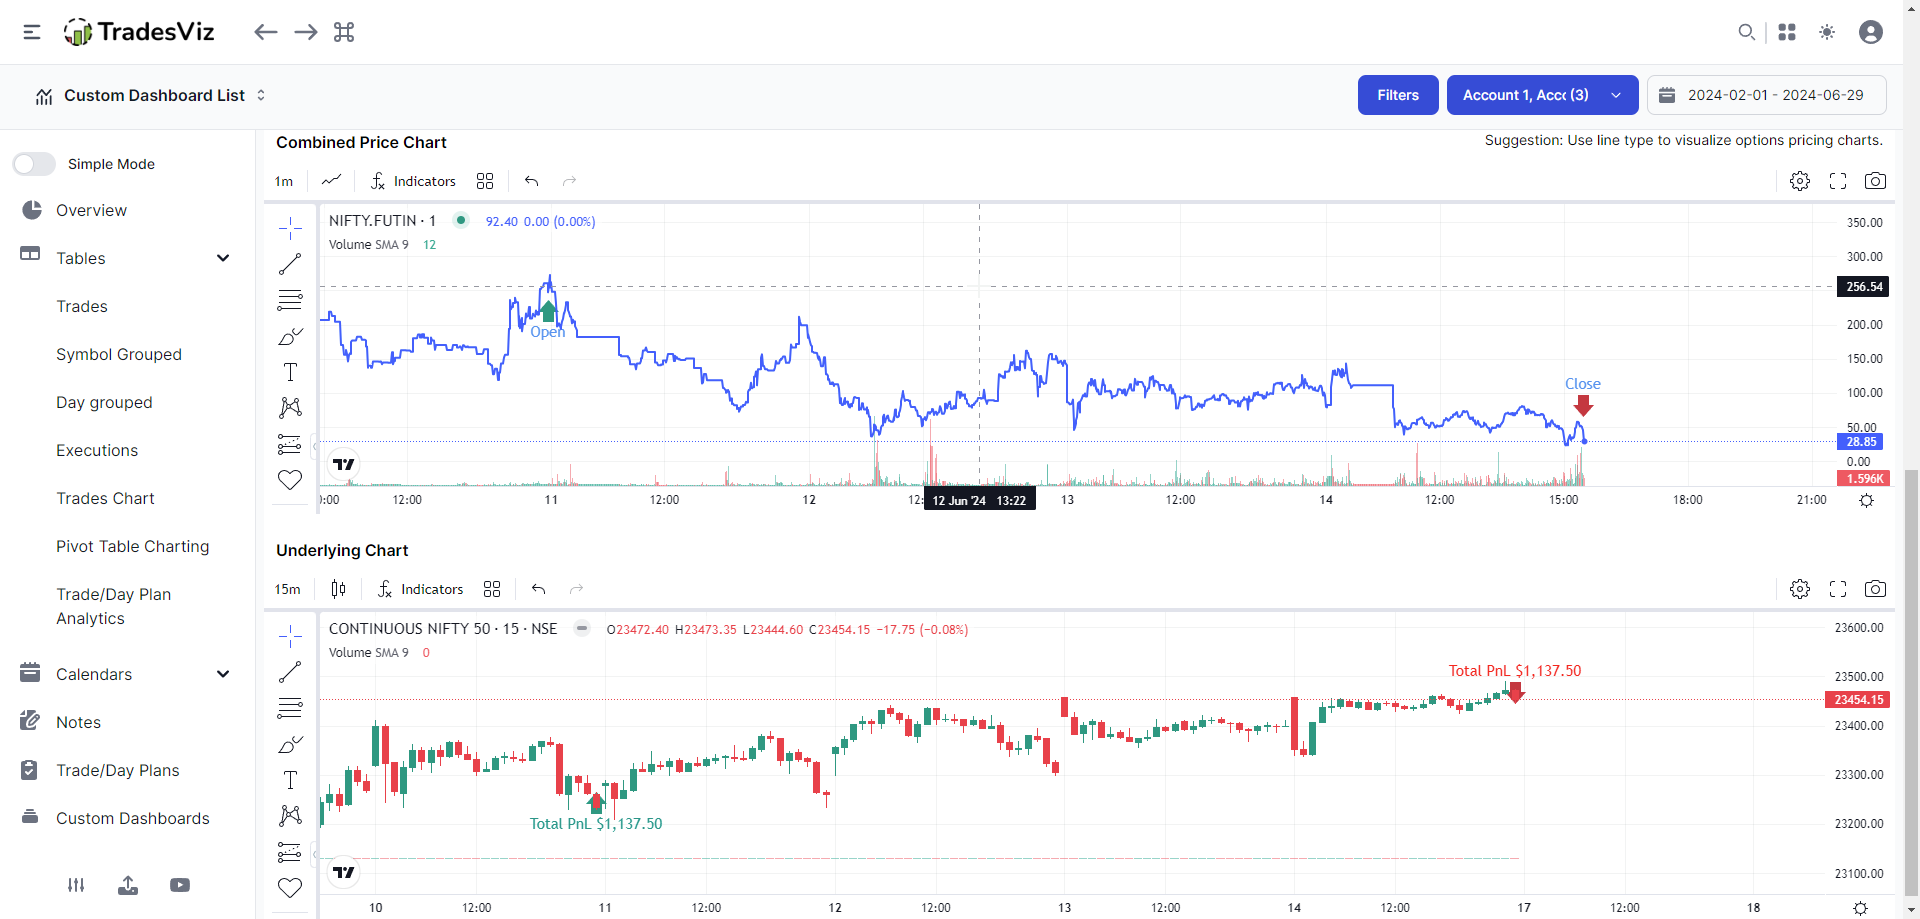
Of course, you can explore each option leg's OHLC chart by clicking on the "i" icon in the table.
This is just the beginning. Our goal is to provide the highest quality tools to traders all over the world to excel in trading in a data-driven way. Step one in our belief, is visualization. That's what we have started with here for NSE traders.
This has been a long-time feature request from many NSE traders in India and we hope to implement more such features in the future! If you have any ideas, or feedback on how we can use this data to help you better visualize your performance, and get trading ideas, please let us know by emailing us at [email protected].