Today, we are launching a new overview type. Overview is the first tab every trader sees when they log into TradesViz. So far, we've had three types of overviews since the launch of TradesViz v2.0, almost a year ago.
Each of the overviews has its distinct uses and caters to specific traders - as we always say, there's no one dashboard or set of stats/widgets that can fit/satisfy all traders. This is why we introduced a custom dashboard and have continually improved it since 2022.
However, for first-time users of a trading journal or new traders, the overview tab itself is more than sufficient to get started. That's why we wanted to introduce a new one. Here's the new overview that you can select using the overview dropdown at the top left corner of your dashboard:

This dashboard is made based on combined feedback we've received since the launch of TradesViz v2.0.
The basic idea is the following:
- Make sure the essential elements are present: table, overall pnl chart, and calendar.
- Make sure the essential stats are present: pnl- and account-related + some trade-based stats.
- Make sure the layout is easy to understand.
- Make sure the layout is flexible enough to be viewed in many screen sizes without any issues.
- All stats should be beginner-friendly - nothing too complex, no stat is "useless" enough to be removed.
What you see above is the result of following all of the above rules.
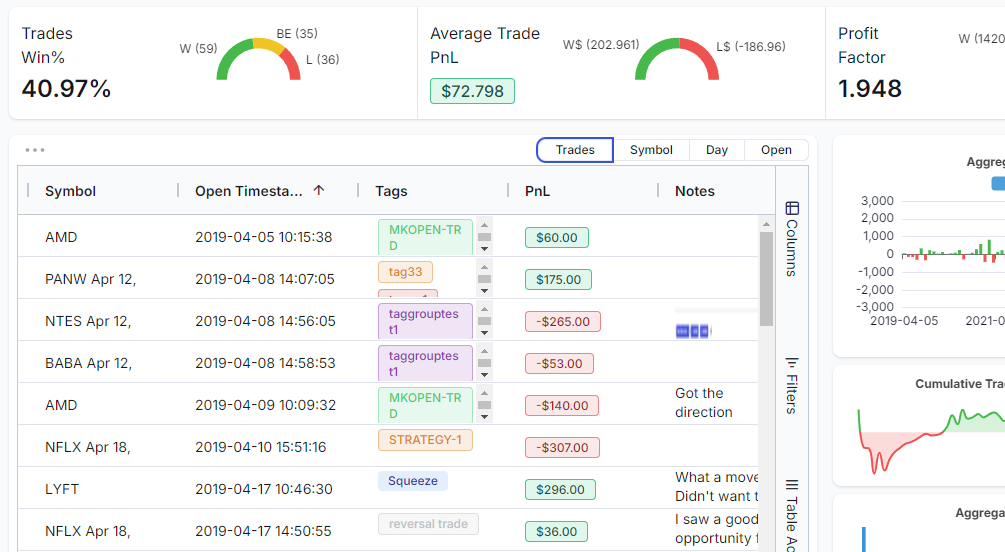
At the top of the dashboard, you will see important metrics for ANY type of trader:
- Win %
- Average trade pnl (how much are you making per trade on average)
- Profit factor: Total winning pnl divided by total losing pnl
- PnL trio: Total closed pnl, total realized pnl, and total unrealized pnl.
There's no made-up stat, there's no complexity, if it's a stat made up of multiple elements like win rate, you will see the breakdown right next to it. Everything is as clear as it can be.
We had common questions like that was the "total pnl". This is a bit confusing because each broker reports this differently. Is it net? gross? does it include unrealized? is it only closed? etc., so many questions! This confused many traders who were using multiple brokers on TradesViz. Since day 1 of TradesViz, we've been crystal clear on our PnL terminology and wanted to bring it to the spotlight with this dashboard.
- Closed PnL: Total PnL of all fully closed trades.
- Total Realized PnL = Total PnL of all trades (fully closed + partially realized).
- Unrealized PnL = Total PnL of all open trades if closed at last EOD price.
- Total Account Value = Total PnL + Deposits - Withdrawals.
There you go. That's it - as simple as it can get. You cannot break it down into simpler parts, nor can there be any ambiguity now. These stats have always been on the Summary > Overall statistics page, but we wanted to bring it to the main dashboard to make sure traders get a glimpse of this at all times.
Up next is the table which has 4 modes: trades, symbol, day, and open. Traders of TradesViz are very familiar with our multi-view tables where we have one table for each view which is accessible under the Tables section. We wanted to reduce a few more clicks here. Instead of navigating to tables, you can quickly toggle between table types right from your new overview page and of course, each table has its own state so you can completely customize the tables to show exactly what you want. The last table "option" is for quickly viewing your open tades.
This upholds our commitment to navigation efficiency and utility - especially when it comes to tabular data. All of this is sorely lacking in every other trading journal (don't believe us? Read more).
On the second half of the page, we have utilized the simplified widgets that we introduced last month to ensure we have enough space to fit in important elements and that the same time, the UI isn't cluttered.
Aggregate and cumulative PnL are two irreplaceable charts in a trading journal. Every single one of our dashboards will have this. Other than next, the next chart of importance is the volume - how much you have traded per day finally, we've decided to include a new chart: cumulative average pnl per trade per day. Upon extensive testing, we believe this to be a far better indicator of a trader's trading *trend* than a cumulative pnl chart. Use it for a few weeks and you will understand what we mean :)
Again, no fancy, made-up stats. All stats are battle-tested and have been extensively used by successful traders for decades.
Finally, you will see a must-have mini trading calendar that's fully explorable (click to view day explore page).
This makes up our new multi-all-in-one overview dashboard which will be the default for all new users going forward :) Of course, you can always change it to any other overview too!
Just for the sake of comparison, here are all our other overview types starting from the simplest, original TradesViz dashboard:

Charts + tables:

All-in-one:

Finally, no dashboard is truly perfect. For this new dashboard, what are your thoughts? how can it be improved in your opinion? what do you think can be added/removed/changed? Please let us know by emailing us at [email protected]!
We have some very interesting features coming this month! Stay tuned to our blog and check your dashboards! :)
