Chart customization features have been explored a lot in other TradesViz blogs. In this post, we will discuss a new feature we implemented to make your charting experience even easier.
In your account settings page, click on "Global Account Settings" to access the chart settings features.

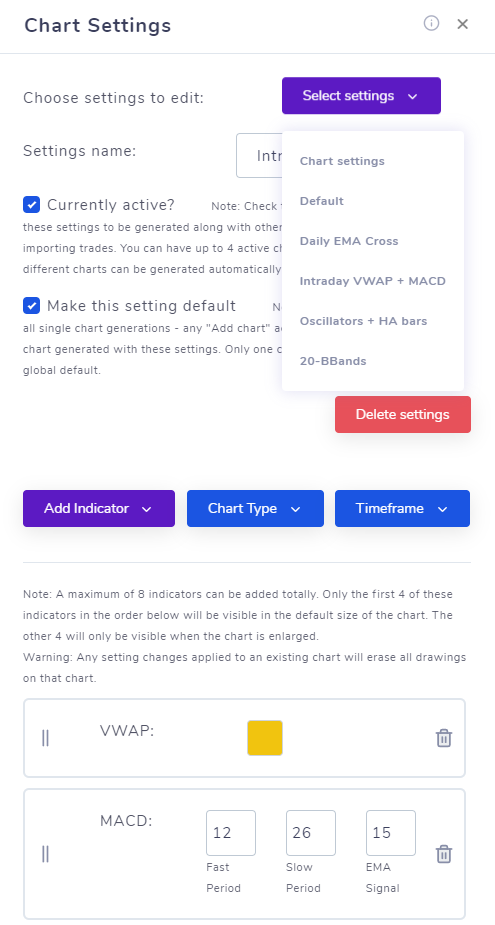
Here, you will now see 2 new buttons instead of just one which was the old way of setting a single chart setting for all chart generation purposes. Clicking on "Add new chart settings" will open a popup similar to the chart settings you might have seen in your dashboard with options for chart indicators, timeframe, and type. In addition to this, you will also now be able to decide if you want a setting to be "active" and/or "default". The edit button is similar - the only difference is that you'll be able to select from a list of your previously added settings and be able to edit all parts of the settings.

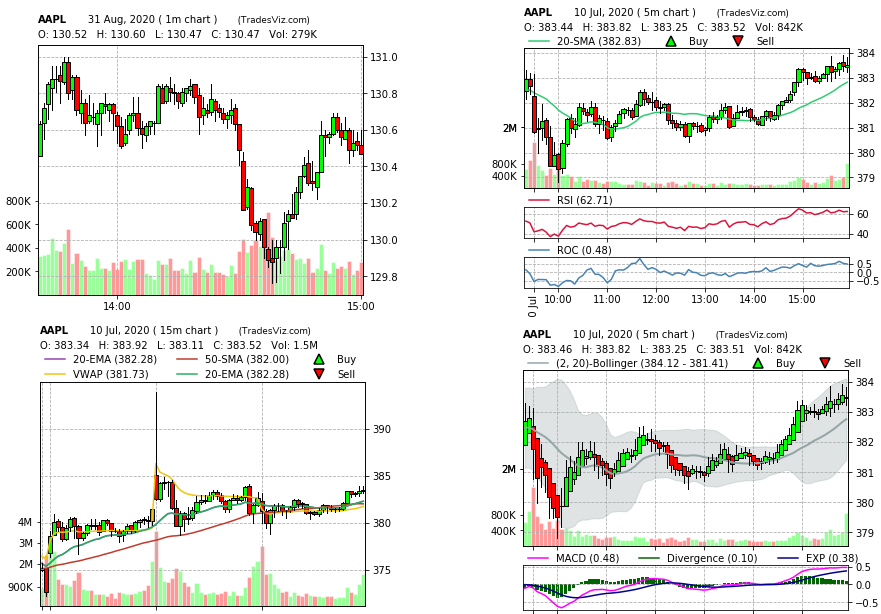
When a "Currently active" is checked in the settings modal (like above), a chart will be generated with these settings whenever you import a trade. Note that, you can have multiple "active" settings - meaning, you can set it so that the system automatically generates multiple charts per trade you import - no more messing manually with chart settings for each trade! This is very useful for trades where they want to look at a daily + intraday perspective of a trade and/or want to view many different indicators all at once.
Finally, you can edit, delete, create as many as 10 unique chart settings you want! To sum up, you can create a total of 10 chart settings each with its own name, keep almost 4 as active ones (meaning, 4 different charts generated per trade imported), and any 1 as the global default settings.
The next option "Make chart default" works a bit differently. We have 3 ways of generating charts - first is via the "Add chart" button for each trade, the next is via a group apply function, and finally, auto-generated charts when trades are imported. The "active" settings are useful only for the last method of generating charts - that is when trades are imported. But for the other 2 methods - you can set a "default" setting which will automatically be used when generating charts individually. That is the meaning of making a setting "default" - it will be used for all individual chart generation purposes. Unlike the "active" option which can be applied to several chart settings, only a single chart setting can be the default! Because these are used for individual chart generations.
A few things to keep in mind when using this feature is, if you update your chart generation settings, these settings will only be applied to the future imports and will not generate charts for the existing trades in your account. Also, if you are importing a large number of trades, you might not see the charts for some trades because the chart generation process is a background process that prioritizes the most recent trades. Easiest way to check your charts is to just sort your trades so that you see the most recent trade at the top of your trades table and explore that trade - you should be able to see the auto-generated charts.
With these features, we hope to make trades journaling more interesting and useful to all trades of TradesViz! This was a feature request from our user. Like this, many user-suggested features have been added to TradesViz since our launch and we are continuing to work with traders to shape TradesViz to be the ultimate all-in-one solution for trade journaling. Please contact us at [email protected] if you have any questions or feature requests!
