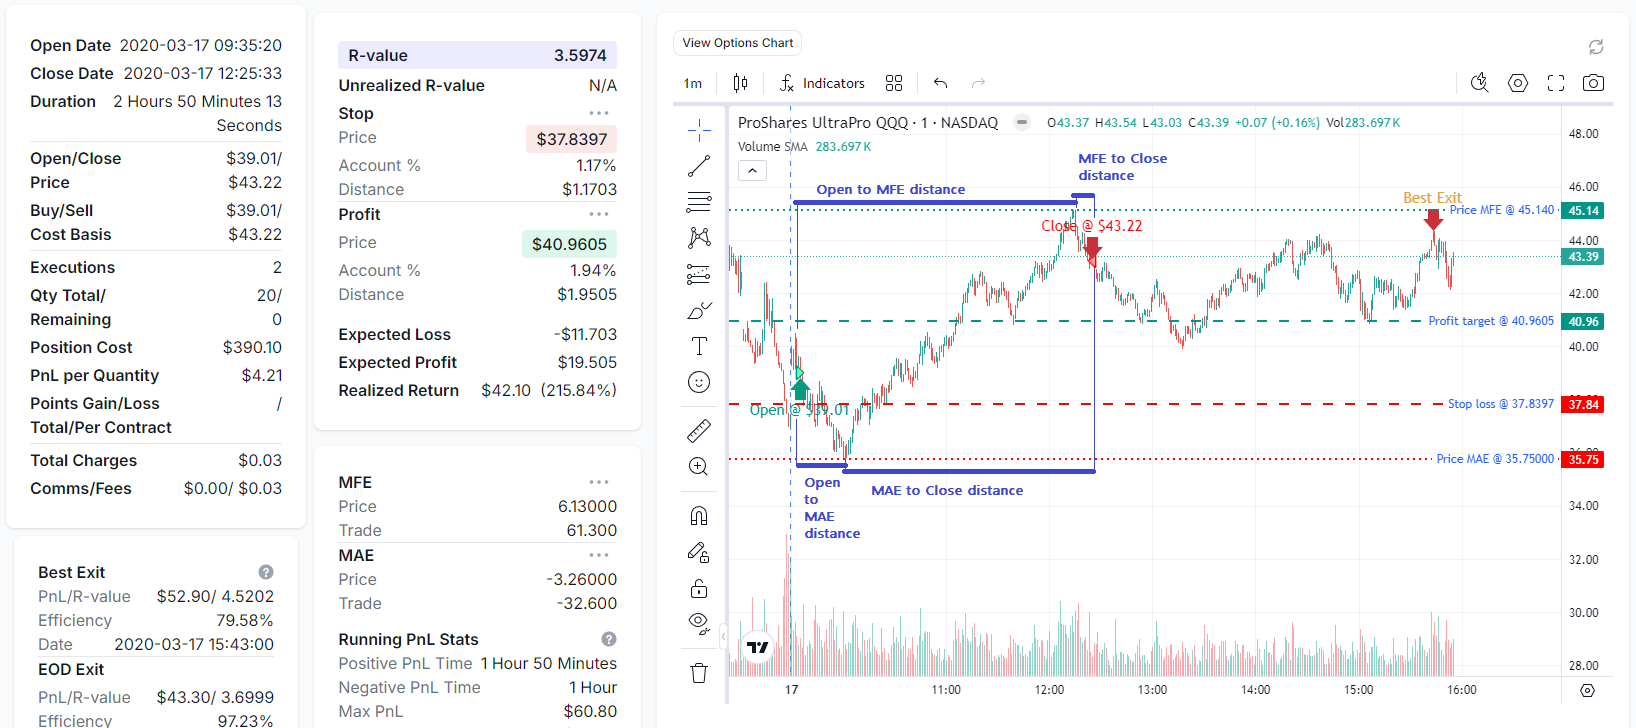
MAE/MAE was one of the first advanced stats we introduced in TradesViz in 2021, way back when journals barely had any risk-based metrics.
Since then, while the actual analysis of the metric has not changed much, we have expanded the availability of MFE/MAE to all base asset types now with the TradesViz being the first trading journal to use 5-secs data for futures and S&P500 stocks MFE/MAE calculation. Consider all MFE/MAE data on any other journal pretty much useless if you intraday trade and your trade duration is in the minutes because as far as we know, every other analytics platform uses one-minute charts for MFE/MAE calculation which is completely useless inn this case.
Now that we've established increased usage and the highest level of accuracy of reported metrics, we revisited the MFE/MAE analytics tab with the feedback we've received from users and wanted to introduce a few more charts with a focus on duration. This idea was a feature suggestion + inspired by our very own best exit and mult-timeframe exit analysis methodologies: focus on duration and timing.
The question is the following: After how long in the trade do you reach MFE or MAE?
A follow-up question could be: Is it possible to optimize your trading based on the duration of the trade from an MFE/MAE perspective rather than just profit?
Observe the chart below. It's a scatter plot where the X-axis (horizontal) is the duration between open of the trade and the time MFE occurred in the trade. The Y-axis (vertical) is the MFE (price). Each dot is a trade where green dots are winners and red dots are losers.
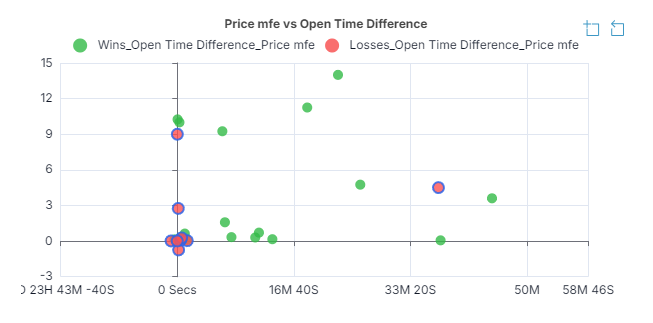
What trend do you see here?
A cluster of losses is on the 0 to 5-minute open-MFE duration mark. To summarise, for our trades to reach their potential MFE we need, it needs to be greater than at least 5 minutes on average.
When a trade is entered, we also need to think about the duration or how long we are going to be in that trade. Some traders use "time stops" - meaning, they exit a trade no matter the result after a set time. While the analysis we present above isn't specific to this type of strategy, every trader needs to start thinking about *how* their trade is going to turn out at ~ 1 min, ~ 5 min, ~ 10 min etc., This is NOT "prediction", of what is going to happen, it is merely an extension your trend based on your own historical trading data. After all, if you are trading a particular strategy, the frequency or reason for opening a trade will be fairly constant whereas, exit condition can change for *each* trade. This is why exit is always more important than entry.
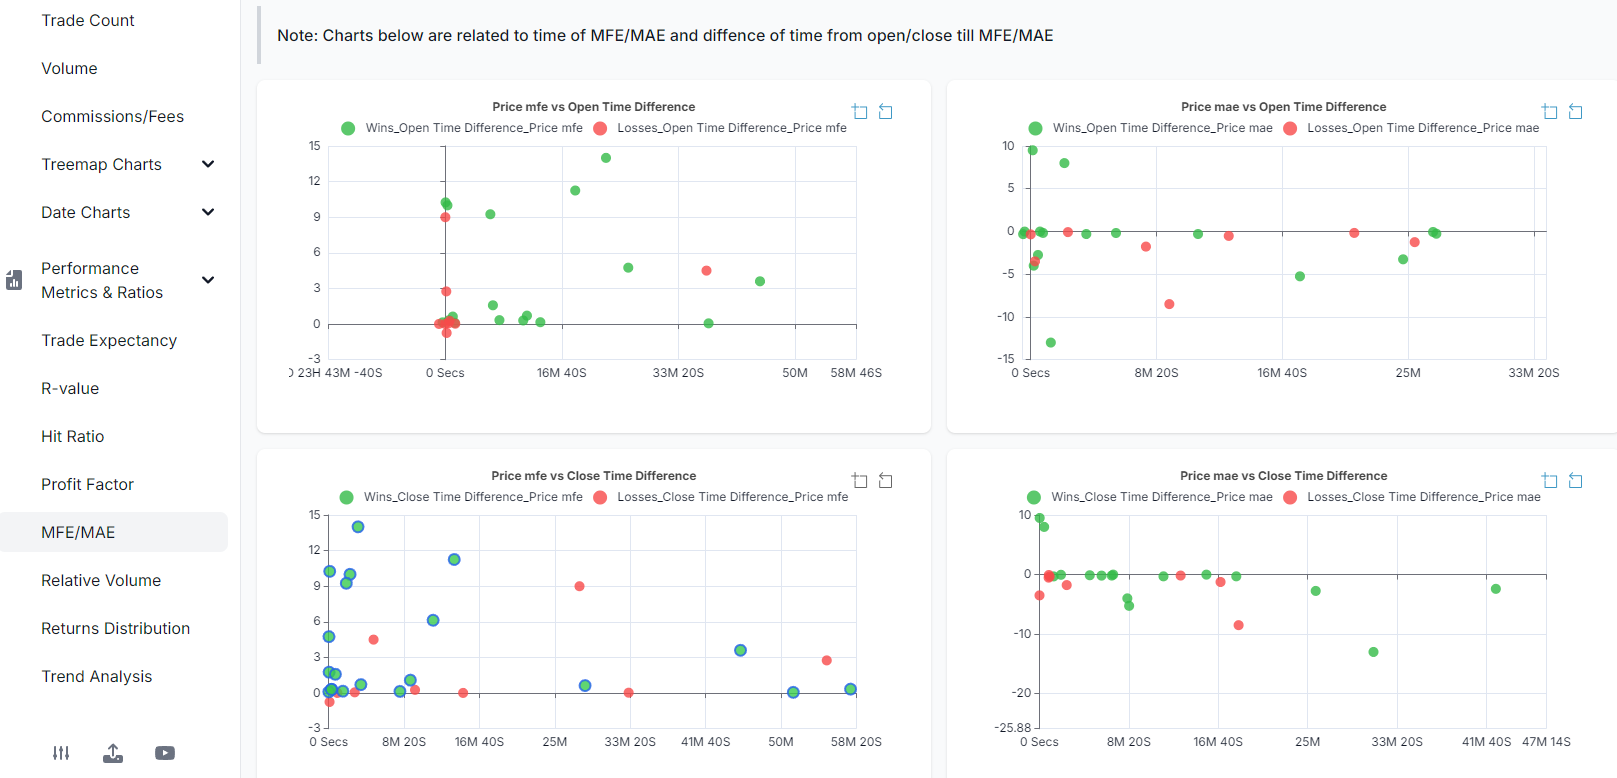
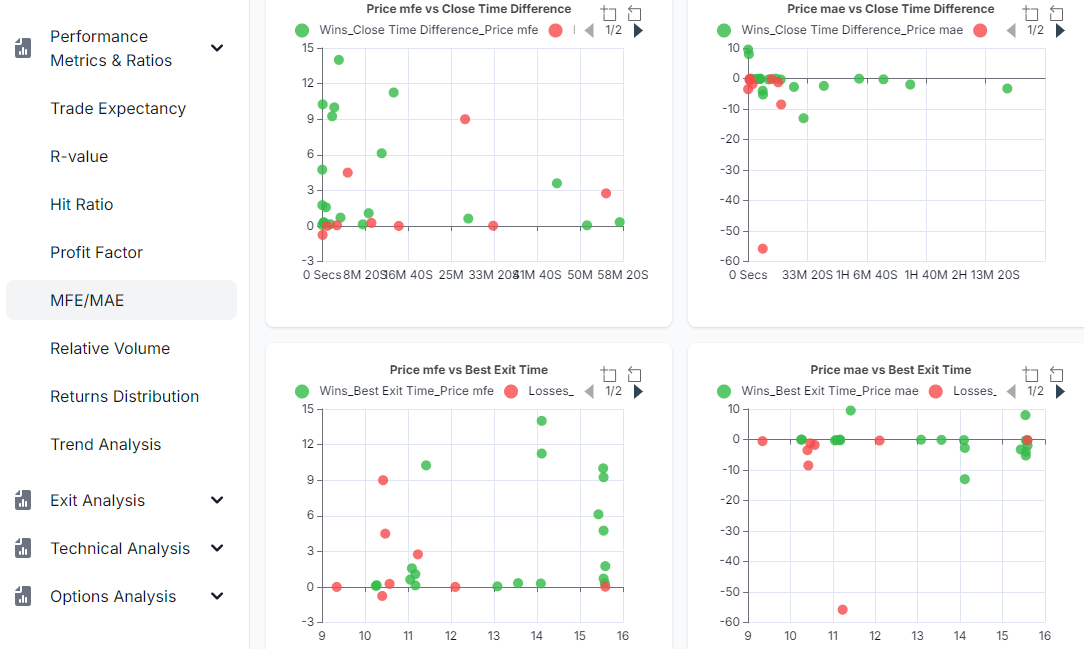
Similar to the case above, the newly introduced MFE/MAE charts now show the relationship between MFE/MAE and the time gap/duration between open to MFE/MAE and MFE/MAE to close. These insights are very valuable if you frequently have questions about when to exit and how to optimize your strategy to cut a trade before it turns into a losing one. List of new charts:
- MFE vs Open time difference
- MAE vs Open time difference
- MFE vs Close time difference
- MAE vs Close time difference
- MFE vs Best exit time difference (duration between MFE and occurrence of best exit)
- MAE vs Best exit time difference (duration between MAE and occurrence of best exit)
Do note that, unlike the other MFE/MAE charts, this is a bit more advanced and requires more data points/trades to make solid conclusions about your strategy. But the point is that, in the current day and age, where your edge can be in ANY factor, no stat or metric should be overlooked if you intend to become a consistently successful trader.
If you are a new trader, focus on just learning what MFE/MAE is, next is to focus on MFE/MAE vs your entry and exit times (correlations), and finally try to work on understanding MFE/MAE vs the durations. Understanding risk -> optimizing entries -> optimizing exits. This is the path we've set for traders who are looking to learn and improve their trading using MFE/MAE metrics.
We hope to introduce more advanced stats down the road to help traders improve performance. Soon, these charts will also be available as chart widgets in the custom dashboard. You can already use these stats in all the trade grids (trades table and pivot grid) to do tabular charting-based analysis and filter based on these stats.
What stat do you want to see next? do you have an idea for a visualization that will make your trading analysis easier? Let us know by emailing [email protected]!