It has been nearly 5 years since TradesViz was launched, and even after 200+ blog posts, 1000s of tweets, and 40+ videos, one question keeps coming up frequently: "How to use a trading journal effectively".
Thus far, no other journal has bothered to properly address this publicly nor be educational in content (TradesViz has the largest public knowledge based on journaling resources and content). This is mostly because journaling education and journaling tools have become outdated. But we're not dragged down by such biases. We've been at the forefront of journaling since our launch in 2019, and that will never change. In this blog post, we will further solidify how effectively journaling can be done with TradesViz.
1. Importing/adding your trades
To do any type of analysis, recording and gathering data is important. Historically, this was done by printing out statements, and then traders moved on to Excel sheets, but all of that is outdated. TradesViz offers 4 ways to import your trades:
- Manually add them (execution by execution)
- Import csv/Excel from your brokers
- Auto-sync from your broker/platform's servers
- Real-time sync for selected platforms
This is probably the hardest step for most users. Why? because every other section below is automated in some way by TradesViz. :)
Don't worry; even if you spend 5 minutes importing, the value you get from the data you import FAR outweighs the effort you put in for those 5 minutes.
To learn more about this, check the in-depth importing guide that covers all 4 types of imports in TradesViz: Importing Trades to TradesViz: A Comprehensive GuideImporting Trades to TradesViz: A Comprehensive Guide
2. The basics: PnL
Ok, you've imported your data. What next?
This is where confusion begins for most new traders. Why? because the stats are new, they may be overwhelming etc. When you are so used to seeing just pnl per day or a table of total pnl per month from your broker, it is normal to feel like a lot is being thrown at you when you check your TradesViz dashboard. Here's the most important piece of advice we can provide:
Umm... but what do *you* need?... Start with the basics: Turn on simple mode and just view simple PnL (profit and loss) charts.
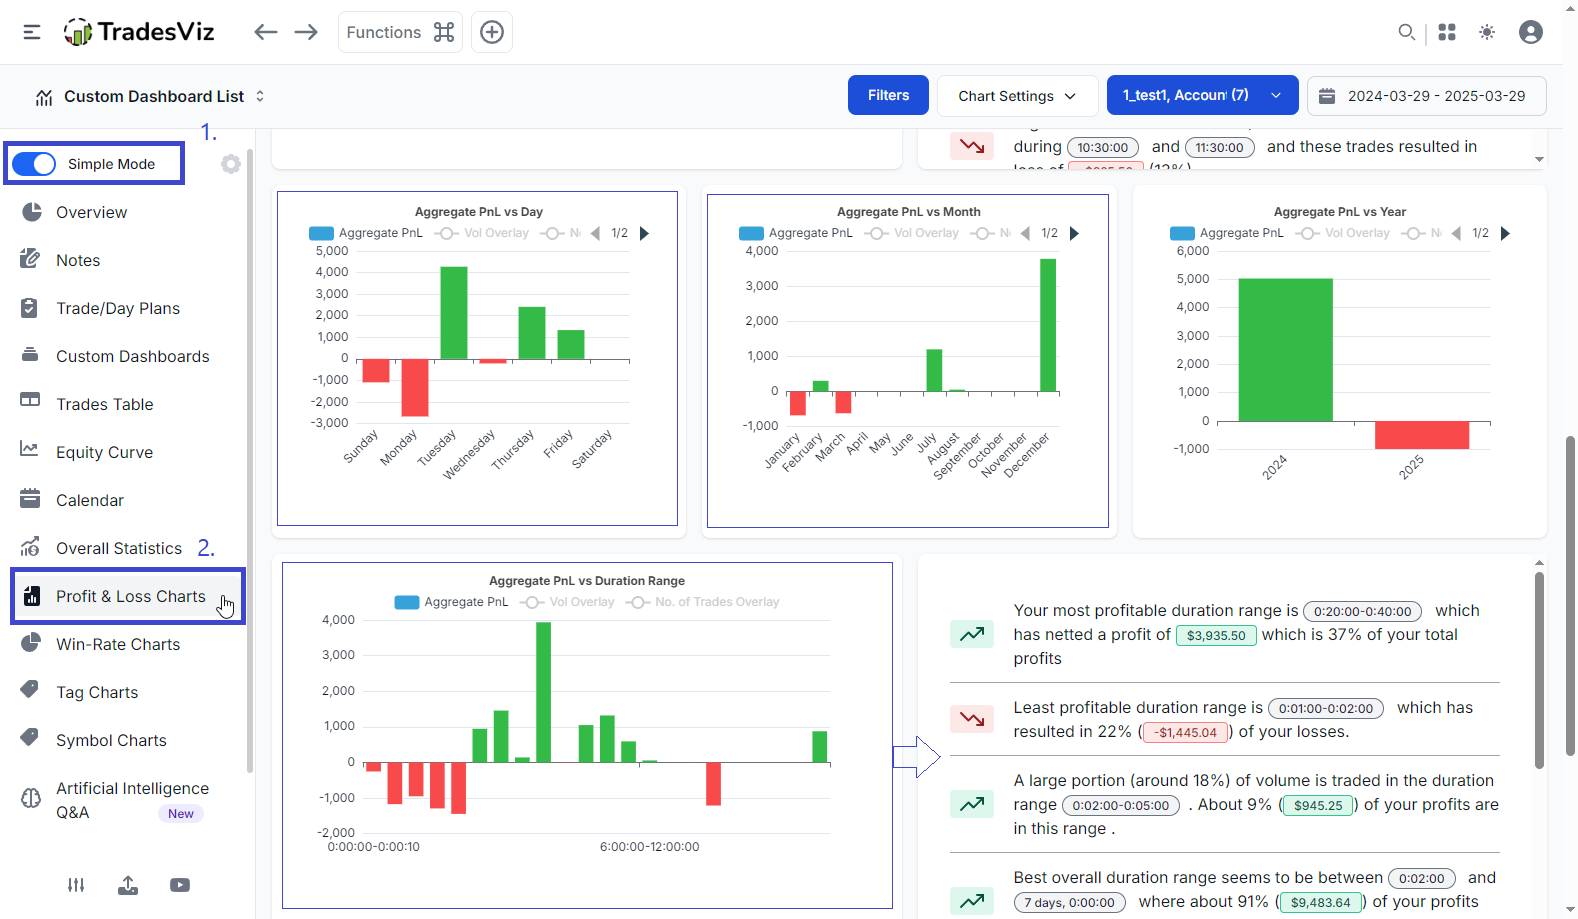
How much do you usually profit if you hold your trades for longer? What about days for the week? Asset types? Maybe trading a lower size is better? All of these are answered here in this single page. Remember that this is just basic, surface-level analysis - we've yet to dig into the truly useful stats. But as a beginner, this is a good starting point.
As an additional feature, you can read the text insights to know a summary of your trading based on multiple data points.
Two more useful features:
Click on a bar to explore what trades you made. Useful when you want to explore outliers. For example, if you see a large bar for a particular timeframe, ask yourself this question: Did this come from a single trade? Or is this really the average performance?

Click on the legend icons (the icons at the top of each chart) to display overlays
Why is this important?
Because when you just focus on Pnl, you will not get the full picture. Image this: You see a time vs pnl chart where it says you made a lot of money at the start of the market - does that mean you traded well at the beginning of the market? No. This is what other journals tell you to conclude; heck, this is what most FinTwit/X influencers/educators tell you.
a) What if all that came from 1 or 2 trades and everything else is a loss?
b) What if you just went all in on a risky trade with high volume and DCA'd till you got out with a profit?
c) What about the other timeframes/times? now if you apply the opposite and assume you don't trade well during 11:00-12:00 range, and stop trading, after a few weeks of adding trades, you will now see a new range where you see red bars - say, the 13:00-14:00 range. Again, assume you stop trading and... well you get the point. Eventually, your journal will tell to just _not_ trade.
Next time you see someone share their pnl charts or metrics without FULL context and anlaysis on ANY social media or post etc., stay far away from that misleading info...
Now, here's a question for you... especially if you are new to journaling: Was this hard to understand?
Sure, a lot of this may be new to you. But we do sincerely hope that you see the value here.
Just to be really clear, we're not preaching some new ideology or strategy; all of this is supposed to be general, common knowledge that you, as an individual trader, can import, learn fro,m and verify on your own that even these simple stats can positively benefit your trading when used right.
Armed with this basic knowledge, you now have basic accountability over your trading. Next time you increase your size or trade on different than usual times, try to recall your stats or just pull up your TradesViz dashboard and check your historical data. After all, just like stock prices, we humans tend to repeat the same patterns too :)
The same concept applies to the Win-rate charts also. These 2 tabs alone should get you through the first few weeks of analysis. Don't expect to find a holy grail trading edge in 2 days. That's impossible and not our main goal. The main goal is to UNDERSTAND the map to get to the edge and that map is your TradesViz journal.
The next most-visited tab would be the most-frequently-posted calendar tab. Other than for your own accounting purposes and just to see a summary of what has happened, there's no anlaysis to do here. HOWEVER, you can add tags and notes to your trading days, which can make your calendar more useful!
To summarize, so far, we have:
- a) learned to import trades
- b) learned to analyze basic pnl using pnl and win-rate tabs
- c) look at pnl calendar
Easy enough? Let's get to more interesting parts of journaling and anlaysis using TradesViz.
3. Layer by layer, Step by Step: More useful insights & planning ahead
Let's start getting real. Most useful insights don't come from just pnl - they come from a combination of your inputs, advanced stats, and all of it together.
Toggle off the "Simple mode" and start checking the tabs under Performance Metrics and Ratios.
You may see a bunch of stats you've probably not heard of if you are a new trader. Don't fret. Don't worry. We'll explain.
Trade expectancy: (Average winning amount x Win ratio) - (Average losing amount x Loss ratio)
Think of this as your average profit (or loss) per trade over the long run. It helps you understand if your trading strategy is likely to make money. A positive number means you're expected to make money on average, while a negative number means you're expected to lose money.
R-value: Total PnL/Total risk taken (based on stop loss that you have for a trade).
This measures how much profit you're making for every bit of risk you took on a trade. For example, if your R-value is 2, it means you made twice the amount you initially risked on that trade (based on your stop-loss). A higher R-value generally means your profitable trades are significantly outweighing your losses.
Hit Ratio: (No. of wins)/(No. of wins + No. of losses)
This is simply the percentage of trades you win. For example, if your hit ratio is 60%, it means you win 6 out of every 10 trades. While it's good to have a decent win rate, it doesn't tell the whole story about profitability because it doesn't consider how much you win or lose on each trade.
Profit Factor: Total profit/absolute value of total loss
This shows you how much total profit you've made for every dollar you've lost. For example, a profit factor of 1.5 means you've made $1.50 in profit for every $1 you've lost. A number greater than 1 indicates that your winning trades are generating more money than your losing trades are costing you.
Returns Distribution: No formula - this is a distribution of your trade's returns and pnl. Read more here.
Imagine plotting all your past trade results (profits and losses) on a chart. The returns distribution shows you how spread out those results are. It helps you see how often you have big wins, small wins, small losses, and big losses. This gives you a better picture of the typical outcomes you can expect from your trading strategy.
Spend a week on this. REALLY, an ENTIRE WEEK!
You will learn more about your trading and your behaviour patterns than any mentor or "educator" can teach you. It's your trading data that shows YOU everything YOU did by visualizing your data in ways you can understand better. This is what we do, and it's literally our name 
The question is simple: Are you willing to spend a few days learning how or if you can modify your existing trading patterns to trade better? or keep learning expensive lessons by losing more money in the market?
4. Marking the hot spots
What do we mean by this? when you have dozens of trades, it becomes near impossible to keep track of what you want to re-visit or analyze. Interesting trades/patterns or high winners/losers or outliers in some way or deviation from strategies or mistakes, etc..
There are numerous such "filtes" that you would want to apply on your database of trades.
The solution for this tags: Everything you need to know about tags, managing and organizing tags in TradesViz trading journal.
Tags can be for:
- mistakes
- setups
- strategies
- market events
- psychology
- emotional state
- risk management
- goals
etc.,
While other solutions restrict you to adding a list of "mistakes" or "setups", TradesViz's unique tagging system allows you to assign any tag to any group and do tag group-based analysis.

Once you enter your trades, this should be the first manual entry you should be doing as it takes minimal effort (you can group many trades at once using group apply) and provides a lot of benefits. This comes under qualitative data and is not something TradesViz fills up for you. Quantitative (numbers) data is already filled up for you, but that is just one part of the puzzle.
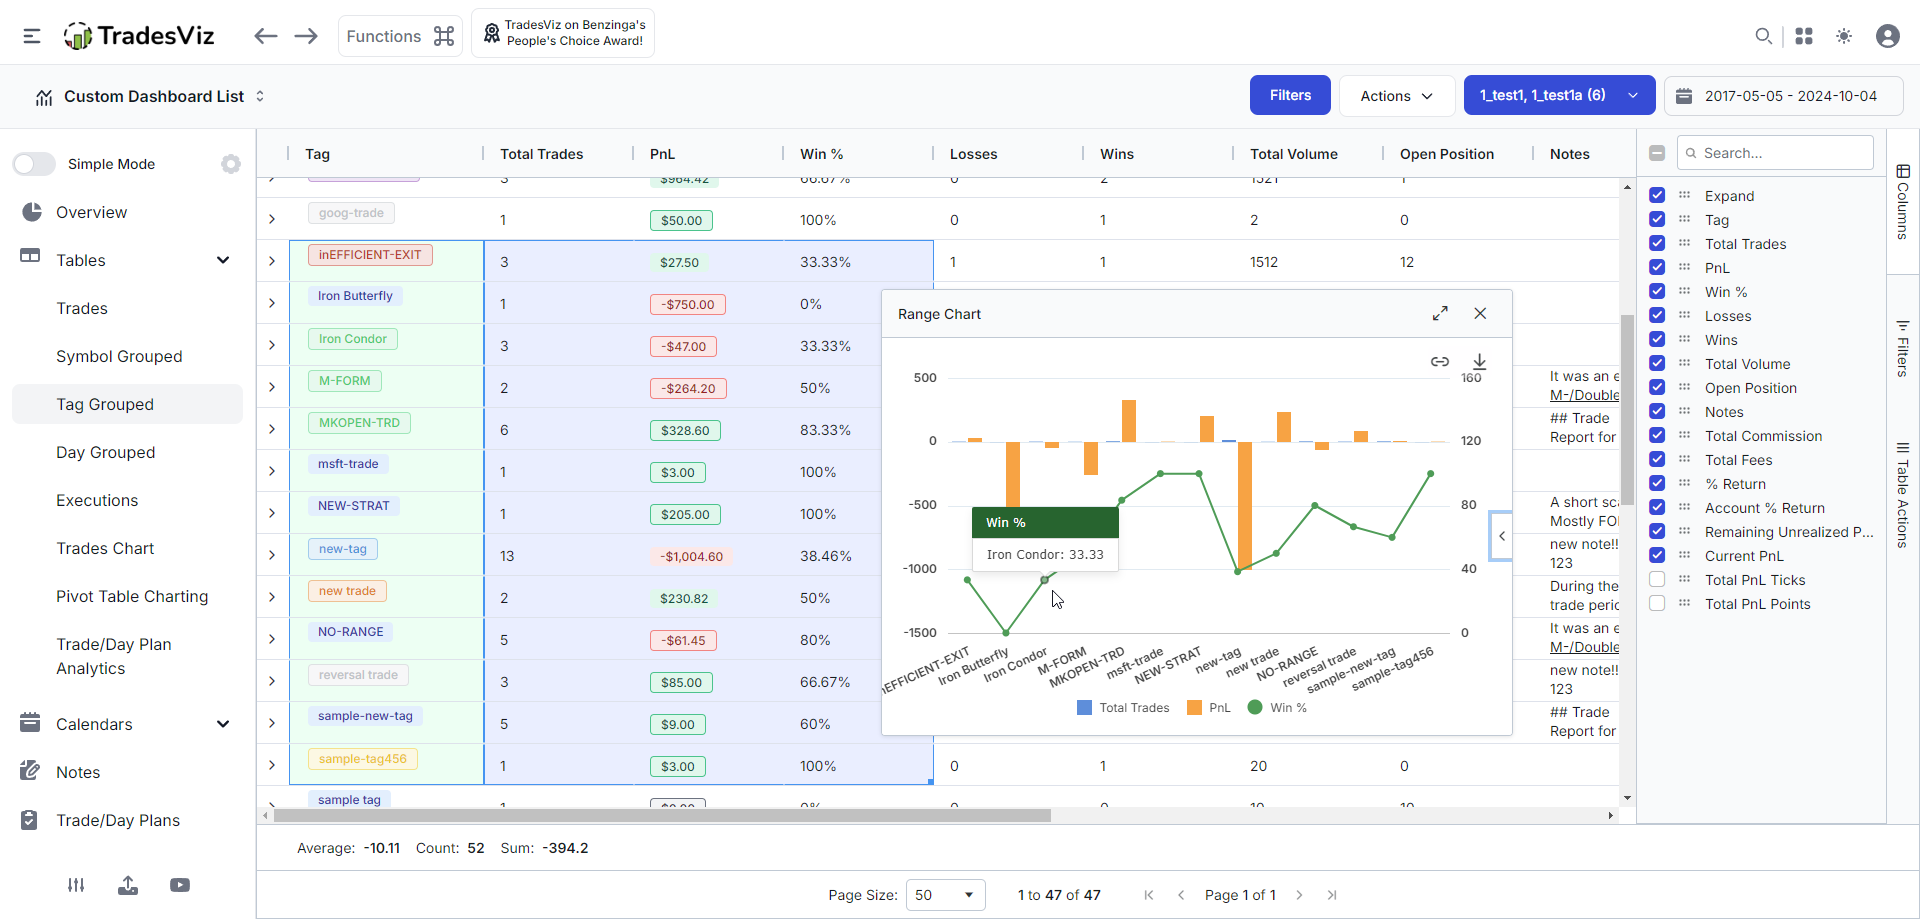
Ok, so why use tags?
You can easily identify correlations with your mistakes, strategies, etc., alongside other metrics - like R-value, expectancy, etc.,
See how everything naturally falls into place if you just organize your learning of the process of trade joruanling? :)
So, start tagging your trades!
So far, we've learned to enter/import trades > do basic pnl anlaysis > understand important metrics > do tagging and get personalized correlations and insights.
This is a great start, and we're not even halfway through the entire process we've decided for you based on TradesViz.
Timeline so far: 1 week
5. Advanced analysis & learning to customize
Read the below carefully.
With your current knowledge level, you should be able to do basic pnl/volume/trade-count-based anlaysis and also learn about R-value, risk management, and expectancies. These are available as charts like the ones shown above and also as a summary in the Summary > Overall summary tab.
You should also have used tables, trade explore, day explore etc., by this point. We assume from the beginning till this point, it would take a new trader ~1-2 days to grasp all of these concepts.
The next thing you should be focusing on is adding tags and notes, which is explored in the next section. BUT, we are going to extend this section with a few more links for traders looking to get a glimpse of what is possible to do on TradesViz. Remember that these may not be necessary for a beginner trader, but the features are always available when you need them.
Advanced stats include MFE/MAE, Best exit, running pnl, etc., and we're not going to discuss them here because this guide is intended for beginners.
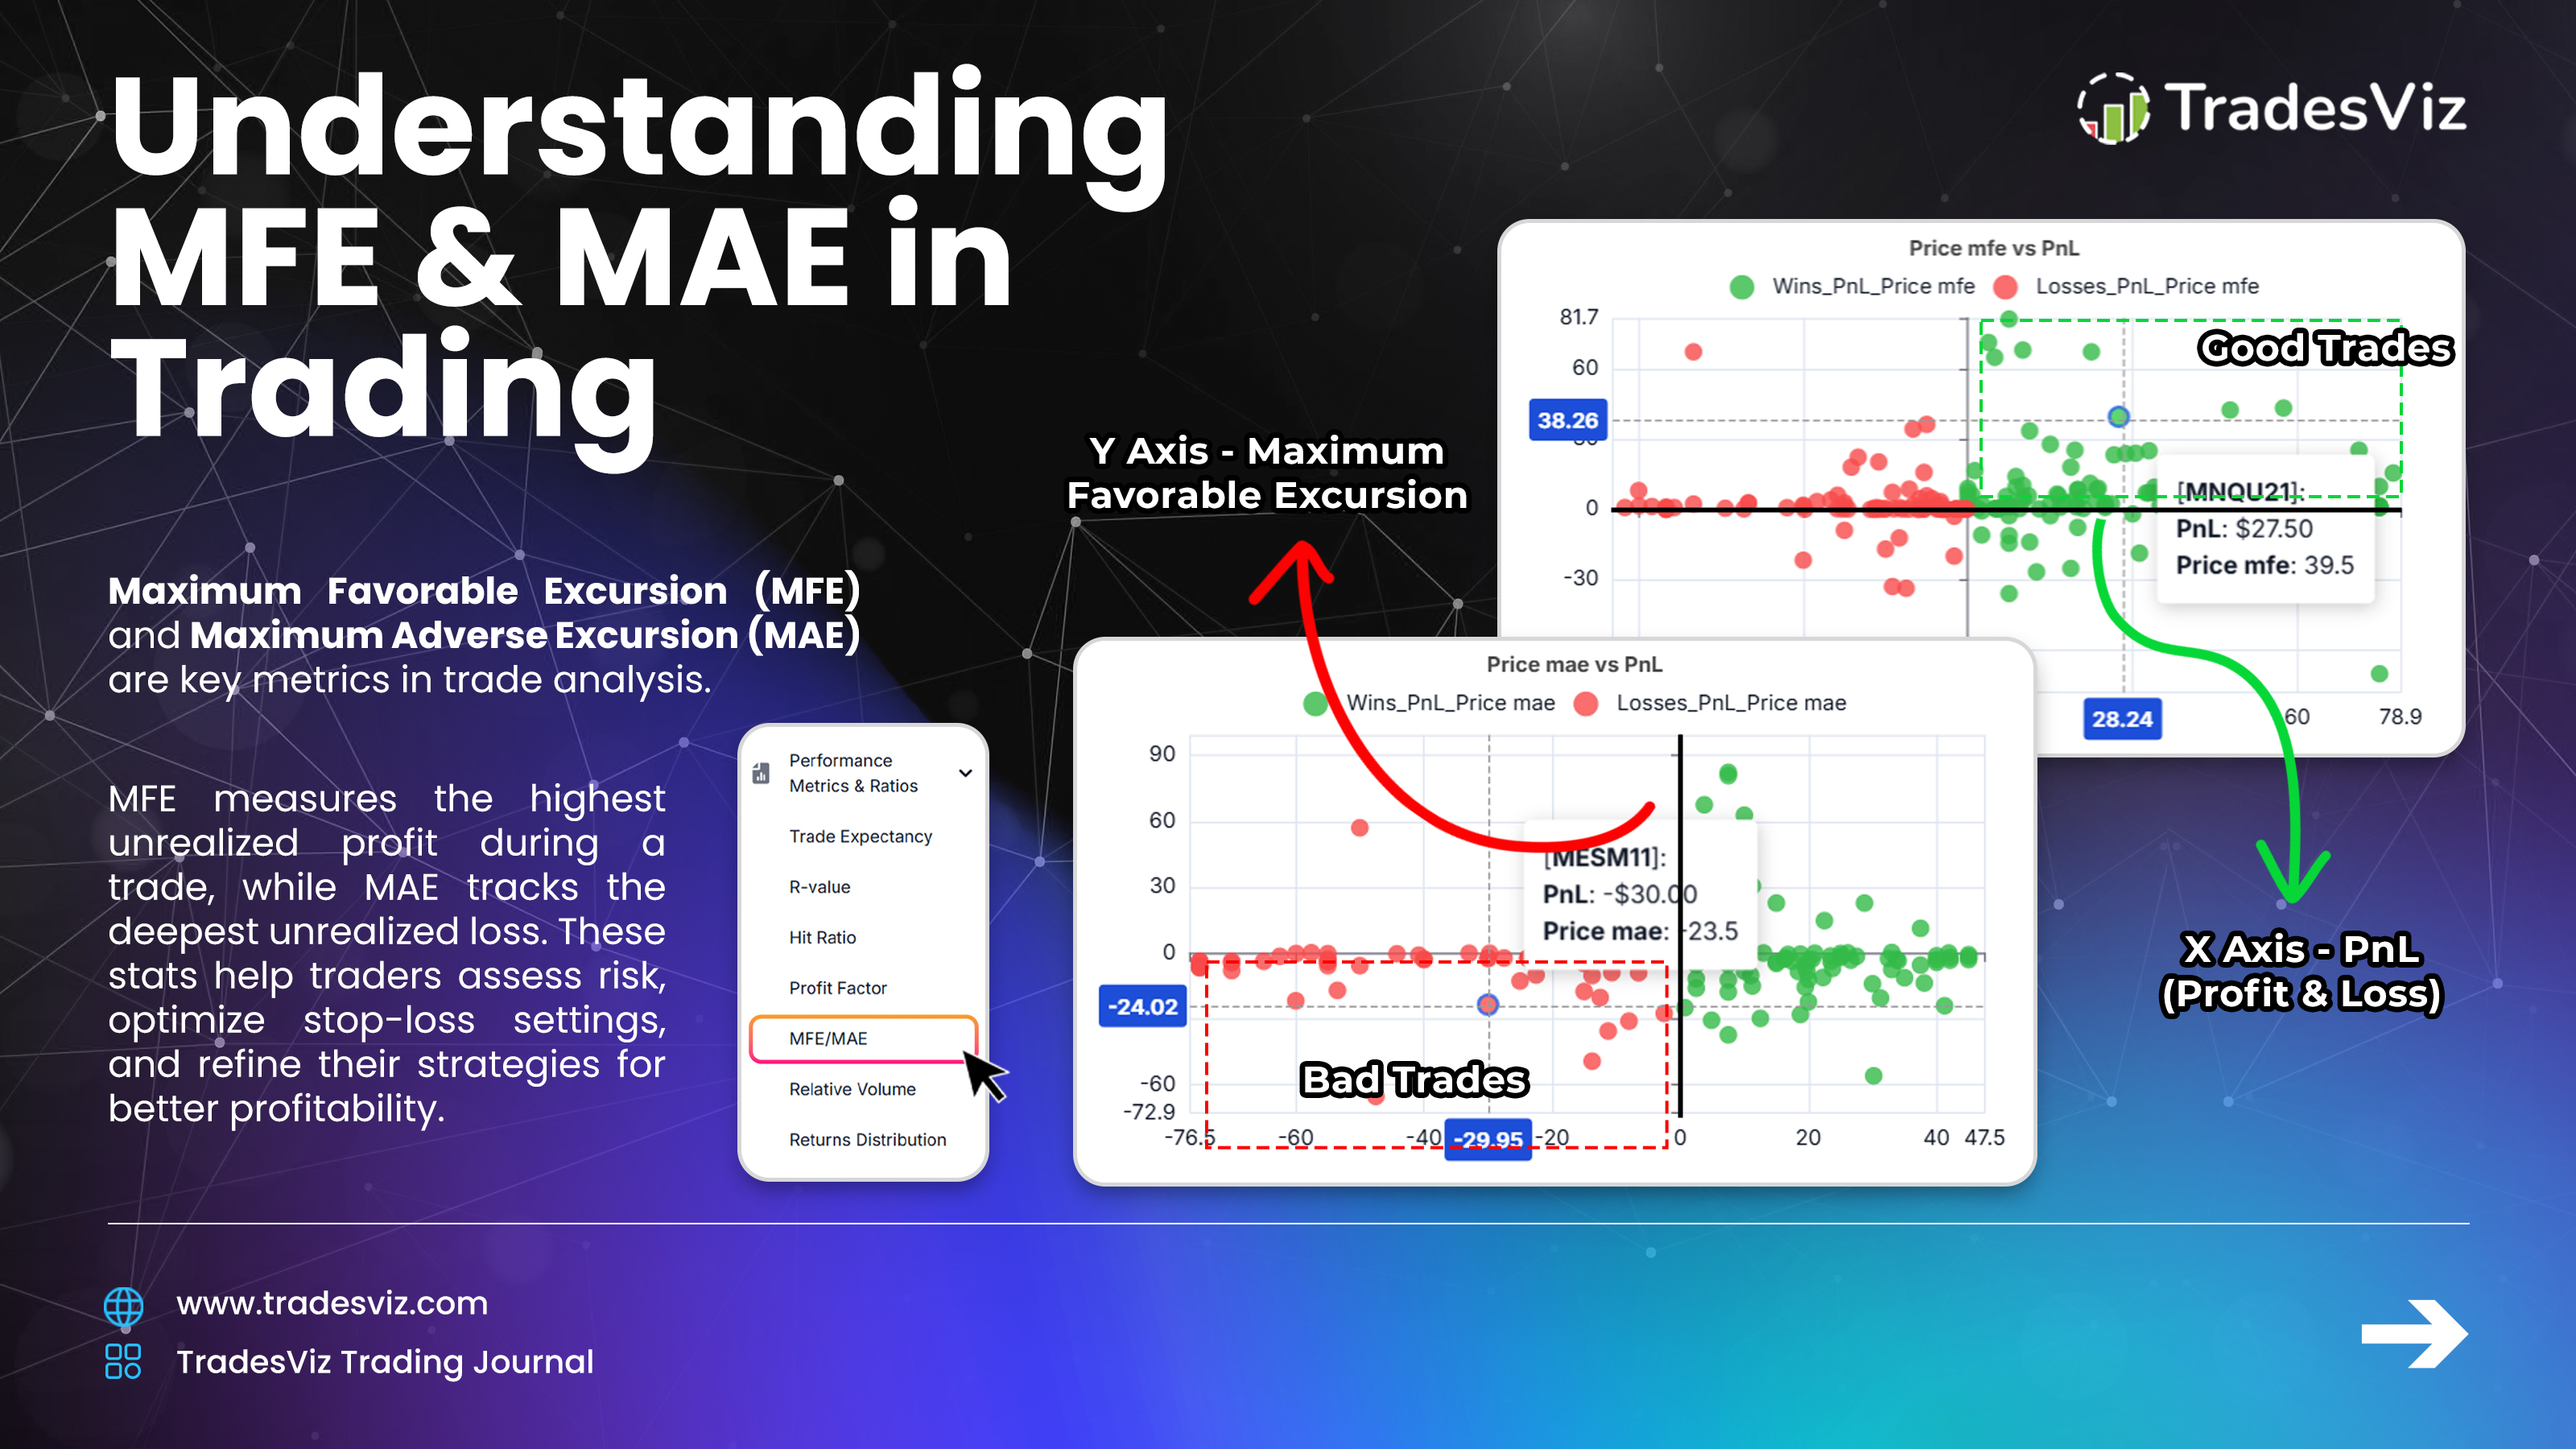
We have plenty of dedicated resources for these advanced stats:
- Intro to MFE/MAE charts
- Running PnL Analytics: How well are you managing your risk and drawdowns?
- Analysis of duration to MFE and MAE
- Exit Analysis Charts
- Multi-timeframe Exit PnL analysis - What if you exited your trade after a day or two?
- MFE, MAE, Running PnL, Best exit, and more: All you need to know about advanced statistics on TradesViz
With just a basic knowledge of pnl, the above concepts would be above your current knowledge level. This is where traders call it quits and forget about journaling, calling it complex.
These advanced charts will provide more in-depth insights into your trading, but before even thinking about using them, please learn to use the basic features.
Every will seem complex when you skip steps. While TradesViz has ALL the charts you will ever need from a basic to an advanced trader, it is important that you use ONLY what you need at YOUR current level of knowledge. This is why TradesViz is a journal that can grow with you.
How can you do this? Custom dashboard, Custom sidebar. Custom everything!
Since everything on TradesViz is customizable, it's a good time to do this regularly whenever you think your trading needs have changed.
* The sidebar where you see the tabs: https://www.tradesviz.com/blog/custom-dashboard-sidebar/
* Every single chart you see in your dashboard: https://www.tradesviz.com/blog/custom-dashboard/
* Even the trade explore page is 100% customizable: https://www.tradesviz.com/blog/customize-explore-tab/
6. Note-taking
Journaling for a lot of traders is actually just "note taking". So no journal is complete without extensive note taking. TradesViz is the only journal with dedicated note taking features like real-time notes, a dedicated note taking tab, AI notes, note tags, and more.
None of these are complex, nor are they advanced. These are basic features that anyone can use.
OK, let's break this down. Do you want to add a note? Is it related to a trade? add a trade note by clicking on the target icon and adding a note:
Is it related to a day? add a day note by exploring a day via the calendar tab and adding a note:
Not sure? add a misc. note by clicking on new note in note tab or via the Plus button dropdown:
That's it, folks!
If you want to take all of this a step further, read this: Everything you need to know about notes, notetaking and organizing notes in TradesViz trading journal
What you enter in your notes is 100% dependent on your experience, knowledge, strategy you trade, and what info you need to offload.
Remember, the whole idea of note taking is to write down your thoughts and experiences - i.e, the "data" that numbers cannot capture.
To simplify this, create templates. Add them anytime, anywhere, and quickly fill in the info.
Was that complex? We hope not because these would be features and questions you would ask once you start using notes.
Assuming we have just plain notes, and you start using them. First question:
> How can I search notes?
Notes tab > Search
> I can't keep copy-pasting notes; I need a shorter way!
Settings > Note templates
> I want to attach notes to days
Calendar > Month view > Click on a date > Add note
> I want to export notes
Notes tab > Export
Remember: Without note taking, your journaling process is incomplete. Don't expect to make full use of the process with just quantitative data. You need your notes, which over time will become the best trading book, 100% tailored and personalized for you.
7. Tracking progress
So far, we've imported, looked at basic stats, added tags, done some intermediate analysis, and written notes of our trades and days. All of these are short-term activities. This means that your stats change every day, your notes are created every day, and new trades are also added every day.
So how do we "keep track" of our trading? Progress can only arise from meticulously tracking what you've done, right? we've been looking a lot into this and added a lot of features to TradesViz to do this precisely.
How do we do this in TradesViz? There are 5 ways.
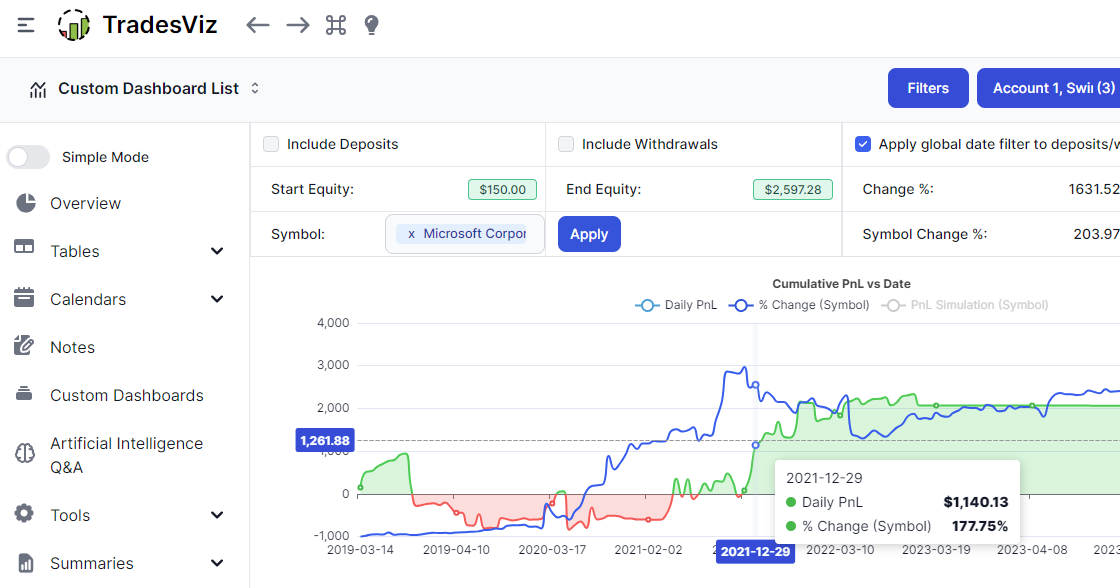
- Summary > Equity curve: Monitor your cumulative PnL along with your deposits and withdrawals and even compare your trading performance with ANY symbol. This is the most basic, simple, easiest way to keep track of your progress (in pnl) over days/months/years.
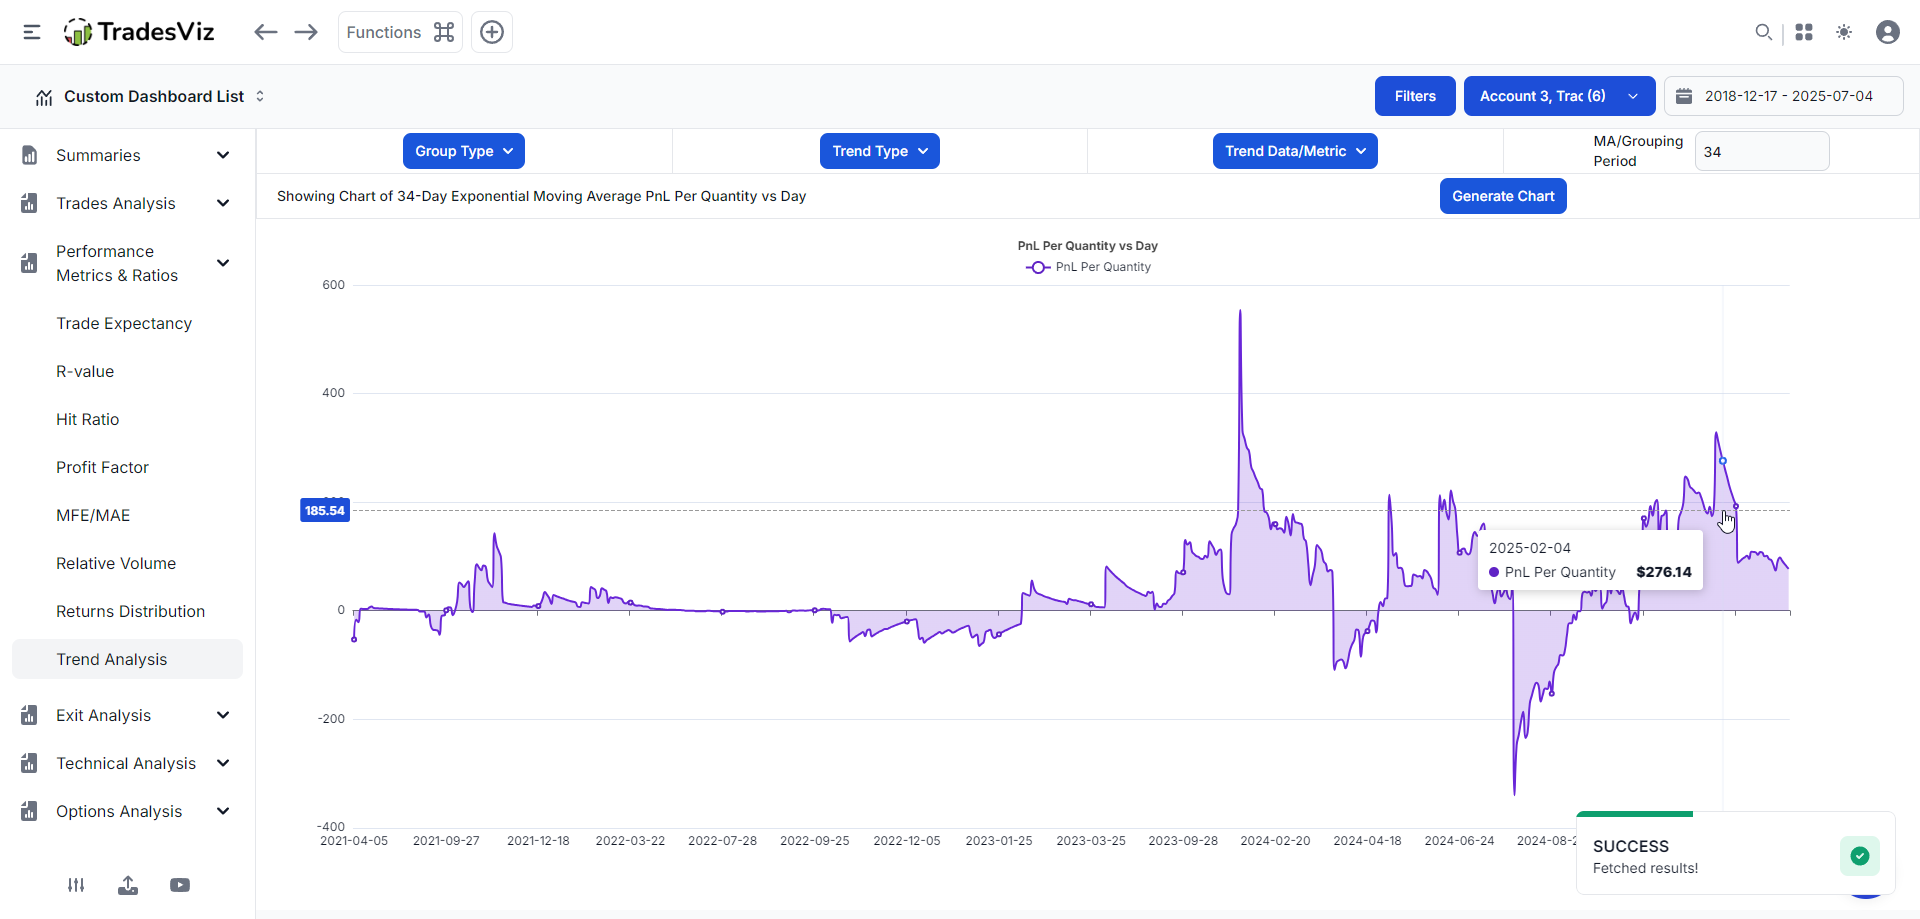
- Performance metrics > Trend Analysis: Notice how we highlighted "progress (in pnl)" in the equity curve section above? that's because pnl is not the only metric you should track. MFE, MAE, pnl/qty, trade duration, etc., are values associated with trades and entire trading days. Just like moving averages in stock, these can also be plotted in the same way. Example: What would be your moving average of pnl over 30 day period?
Question: What if such an average falls below a certain number? would that mean you should change strategies? re-evaluate market conditions?
Do you now realize how much value your data holds? All of this is shown to you on TradesViz.
-
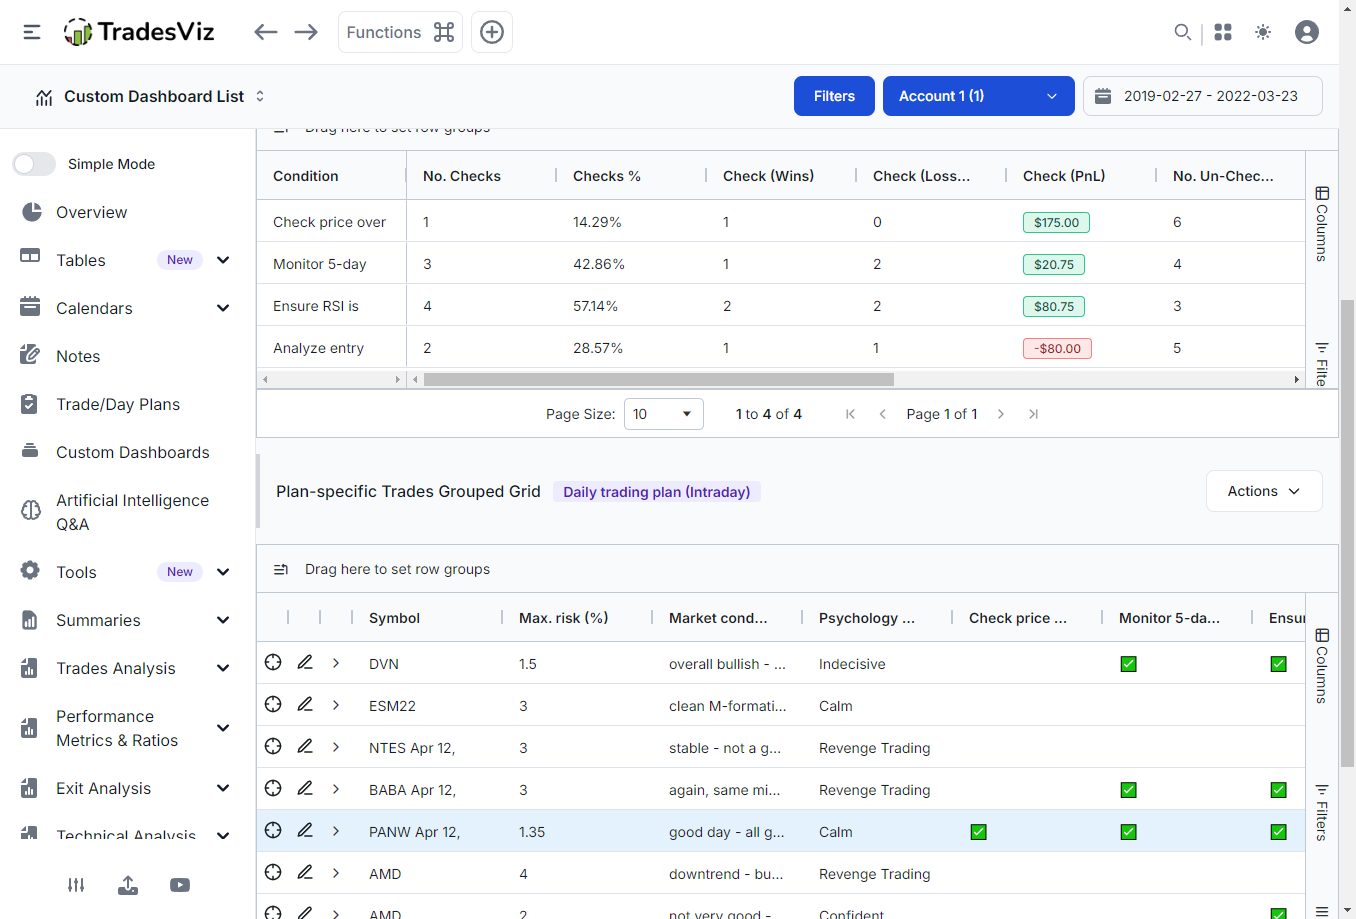
[ADVANCED] Tables > Plans Analytics: This feature has been discussed many times on our blog, and we've also made a very in-depth video about its usefulness.
Fact: This is the most used and liked feature by advanced traders on TradesViz because it lets them capture the metrics that THEY need in the way THEY want.
Here's a simple example: You can define your own conditions/plans and track them over days/trades on how well you followed those conditions and how it correlates to your trading. This is the end-game journaling feature that lets you define 100% custom numeric or categorical stats and attach them to your trades and lets you analyze them with an advanced pivot grid.
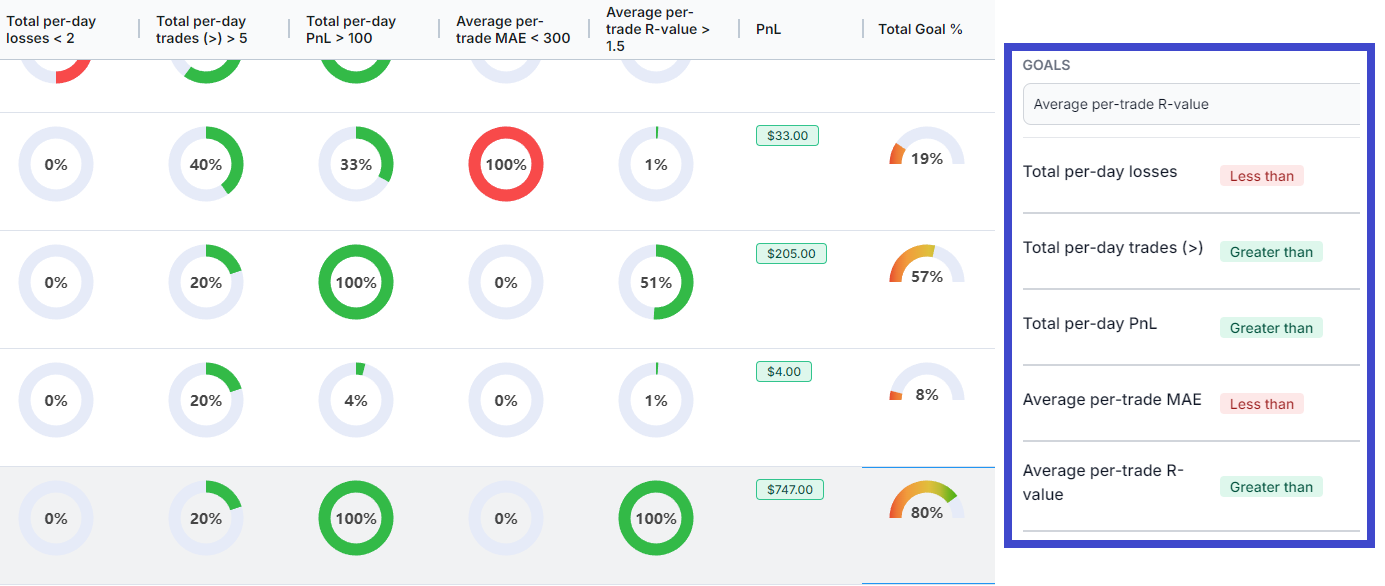
- Tables > Goals: Set goals and track them. Simple enough, right?
Everyone has daily/weekly/monthly goals, yet there's literally no journal that tracks this. Max loss, no. of stop triggers, max commissions, min. pnl, MAE stats - all of these can be set as goals and you can get a score for each day/week/month - all in a filterable table in TradesViz.
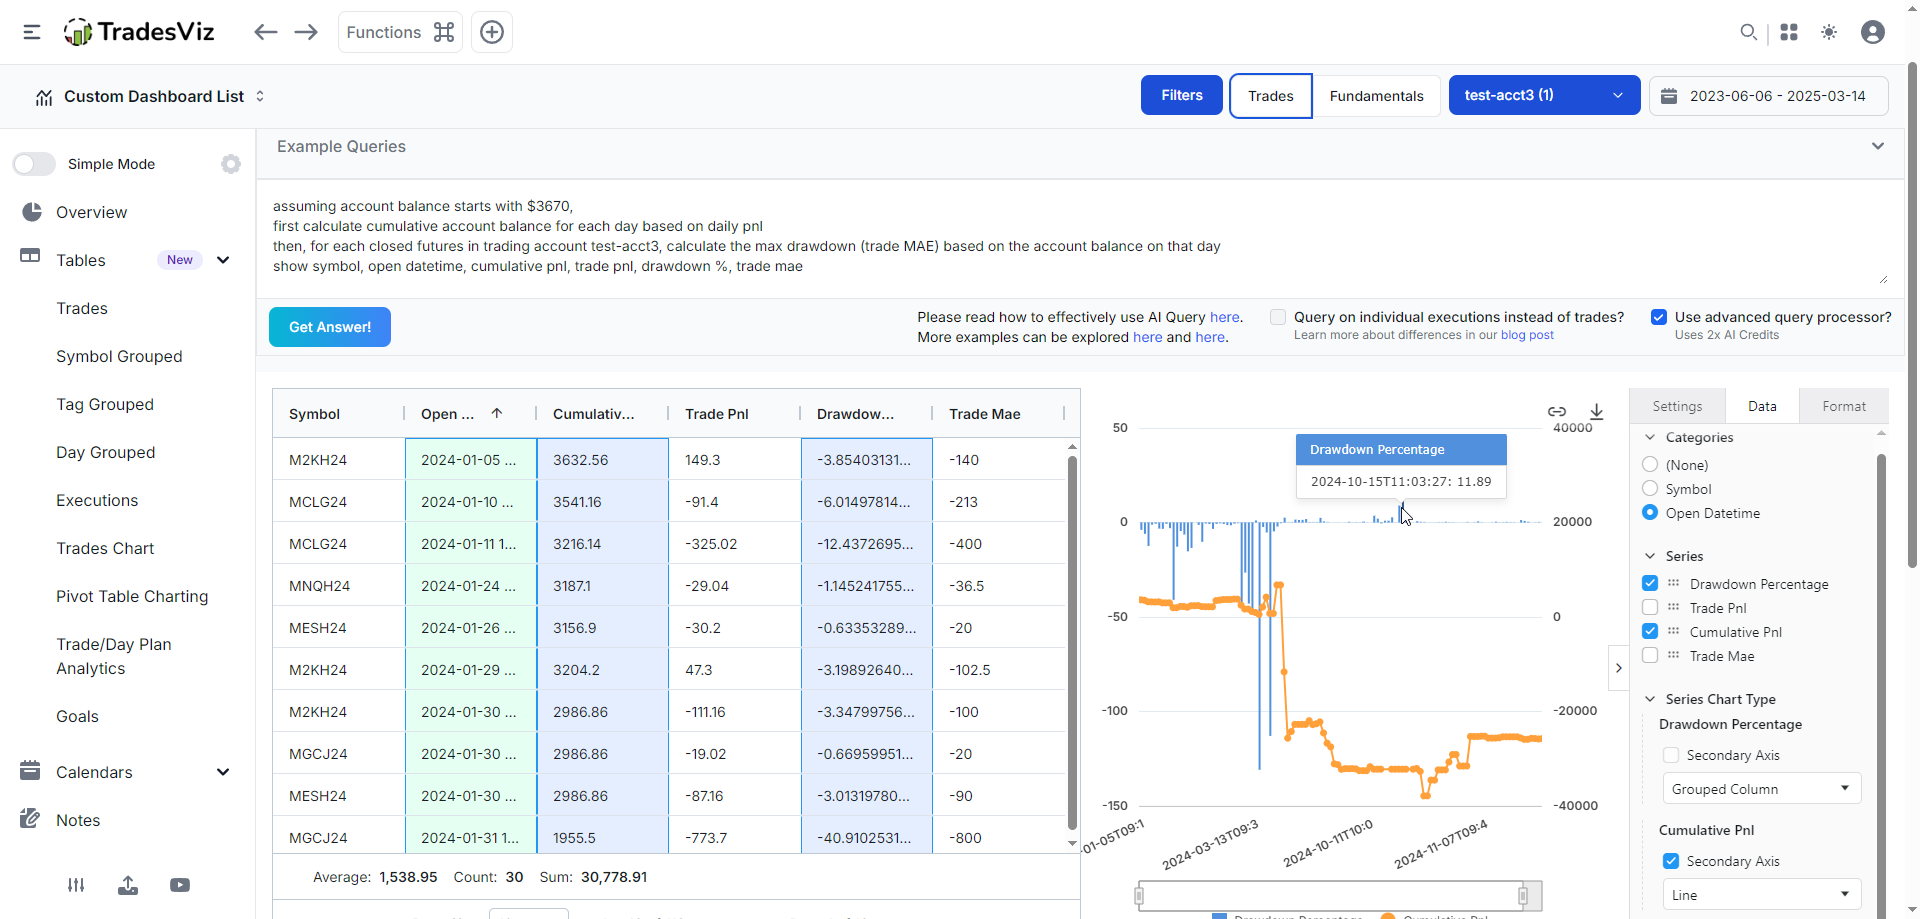
- AI Query: Finally, If none of the above fits you, design your own way of tracking using AI query :)
You have access to the world's best AI models combined with the advanced data analytics structures of TradesViz, which lets you build 100% custom stats and metrics and visualize them. For example, the AI query below shows tracking of drawdown.
Note that these are just features we've seen traders typically talk about when a topic of "tracking" stats some up. There's no solid rule on how you should use these features. You can even track averaged stats via Date charts under Trades anlaysis if all you need is a trend of your pnl, win rate, and long/short, etc.,
All of this is to show you how complete and expressive TradesViz can be when it comes to trade and trading performance tracking over time.
At this point, if you think, "woah, this is very complex and advanced", remember that you can STILL stick with just simple equity curve tracking.
While we've never forced any feature on users, we do want to emphasize this:
8. Practicing ideas
Ah, the "practice" often shunned by many traders. Paper trading. Why? mostly because those traders assumed that the paper trader carries over to the real world 1:1 and got burned.
Just kidding.
or maybe not..
But really, why did paper trading get such a bad rap?
One reason is the lack of proper tools to practice. Practice typically meant looking at past charts and predicting the trend and then checking what happened. But this becomes boring after a while, and it's more technical analysis exercises rather than actual "practice".
We stand firmly by the rule that 1-2 hrs of proper simulator practice while respecting the rules of the trading system you follow WILL carry over positive effects to real trading.
That's why we focused so much of our efforts on our simulators. We clearly differentiate between replaying something, simulating something (most closely related to practicing), and backtesting something. Unfortunately, marketing-first journals have messed up this terminology and now traders are confused between "backtesting" and "simulation". Read this: Simulation, Replay & Backtesting in TradesViz: A complete A-Z guide to using all the simulators to improve your trading.
Here's a clear example. What would you have done in this trading session below:
- What would have been your thoughts?
- What would have been your stop loss and profit targets/risk management strategy?
- Would you have entered a trade at all?
- Did you see something after the fact and thought you should have taken that trade?
etc.,
That's literally it. That's intraday trading practice, which is applicable to stock, future, forex, option, CFD, crypto, you name it - the concept is the same. This is the #1 use of a simulator. It's to SIMULATE YOUR DECISION-MAKING process.
Now if you understand this concept, then you will understand that pnl is meaningless in the simulator. So next time you think you made $$$ in the simulator and are ready to jump into the real market, ask yourself: can you make the same decisions in the same duration without hesitation or effects of the "real money on the line" fear?
For most traders, the answer is NO. This is why new traders end up paying "expensive lessons" by losing in the market what they could have learned for FREE in the simulator.
So, coming back to the flow we've been following. Importing trades > analyzing stats > adding data (tags/notes) > deep-dive into data > setting goals > and practice. At this point in the pipeline, you should be well versed in most trading terminology and tools in TradesViz. You should know what your goals are and what actions you need to take, and you should plan a timeframe accordingly. This path towards your goal will include a lot of practice sessions. Analysis, note-taking, etc., are crucial, but they are like theory. Theory + practice = faster progression. Practice can be done in simulators.
TradesViz not only has simulators for ALL US stocks, futures, and global FX pairs at second-level data, but we also have a global/universal simulator (30,000+ tickers) for you to practice on nearly any timeframe over 1 minute,

Above is an example of HDFCBANK (a popular NSE/Indian stock) simulated on the global/universal simulator on TradesViz.
On top of this, we have multi-simulator (shown previously) that let's you trade multiple symbols on multiple timeframes - this is the closest you can get to market-level feeling with multiple timeframes/symbols all ticking at the same time.
Remember: You can add tags/notes to your sim. trades as soon as you execute a trade as all your trades are shown/updated in real-time!
Finally, a one-of-a-kind feature, the options chain simulator, also exists on TradesViz for intraday options traders who want to carve a trading edge for themselves through intense practice.
We've seen so much benefit from this, we even created a practice mode for our simulator. All of this requires you to sit down, spend time, try, learn, again and again for many symbols, in different timeframes, under different market conditions.
THIS is what we mean by practice. Did you see ANY mention of pnl above? No. It's purely about doing the same thing again and again and again until it becomes second nature to you. Of course, nothing can replicate the feeling you have when real money is on the line, but using that as an excuse and not practicing at all is just slowing down your progress.
9. Re-evaluation
We're almost there.
At this point in your process, you must have realized what went wrong and what you need to work on, what works and what you need to strengthen.
- This is the time when you ask yourself questions.
- Are you forcing yourself to trade a strategy or an asset type that does not fit well with your risk management rules?
- Are you making trades without properly planning?
- Are you overtrading?
- Is your psychology/mental state not ready to tackle the strategy/size you are trading?
etc., these are just some examples of questions. There are many more questions you can ask yourself about your trading.
Why ask now?
All the quantitative and qualitative analysis, practice, and journaling you have done so far are the answers to the above questions. Without those, you cannot 100% answer any of the above questions.
Check your notes, check your tags analysis, and check your risk management stats -> Find answers. This is where you will find your trading edge. This is where you will learn one thing you can avoid or do to get to the next level.
This is also the hardest of the 10 steps we discuss in this blog post. Coincidentally, this is also the step most traders skip... :)
Maybe now you can understand why trading has a 90% failure rate...
Spend ~2 weeks on this one step alone. It will involve re-visiting a lot of previous steps, re-checking a lot of charts, conducting mini-experiments, and more. It will be tiring, it will take time. But this is a hurdle you need to get over.
10. Repeat
Steps 6,7,8,9, and 10 -> Repeat until and even after consistent profitability. That's it. It's not hard to read and understand this (we hope), but it is hard to stick to this regime and have the discipline to dedicate your time and effort to mastering a craft like trading.
Remember: There is no free lunch, there are no shortcuts, and there are no holy grail indicators. Focus purely on how you were last month and how you are doing this month, and ignore all the noise on social media. TradesViz has plenty in store for you to learn from and grow :)
It's not a tedious process - 90% of the above is automated in TradesViz.
It's not expensive - TradesViz's highest tier is ~3x cheaper than most other journals (New user? use discount: `TVIZNEWUSER`)
It's not time-consuming - 15 minutes per day is sufficient to tag, write notes, and evaluate recent trades. 1-2 hr per week is sufficient to practice using simulators.
It IS useful - TradesViz provides a clear, objective record of your trading activities allowing you to identify your strengths and weaknesses. The usefulness is evident in the actionable insights you gain about your strategy, execution, and psychology using both qualitative AND quantitative analysis.
It DOES work - The effectiveness of trade journaling in TradesViz is backed by countless successful traders who attribute a significant part of their success to this practice. Consistent tracking, anlaysis, AND practice TOGETHER help identify and eliminate costly mistakes, refine their strategies, and develop the discipline required for long-term profitability. The principles of continuous improvement and data-driven decision-making are at the heart of why journaling works. Data anlaysis works.
It DOES take time - While TradesViz automates many aspects of journaling, the process of thoughtful analysis, note-taking, and re-evaluation does require a time commitment. However, the time invested in journaling is an investment in your future trading success :)
Instead of spending (wasting) for the next winning/holy grail indicator or watching the same old technical anlaysis by yet another influencer/course-seller on YouTube, if you can spend 10% of that into your journaling and practice, your gains will be much bigger.
It's simple. It's just the Pareto principle applied.
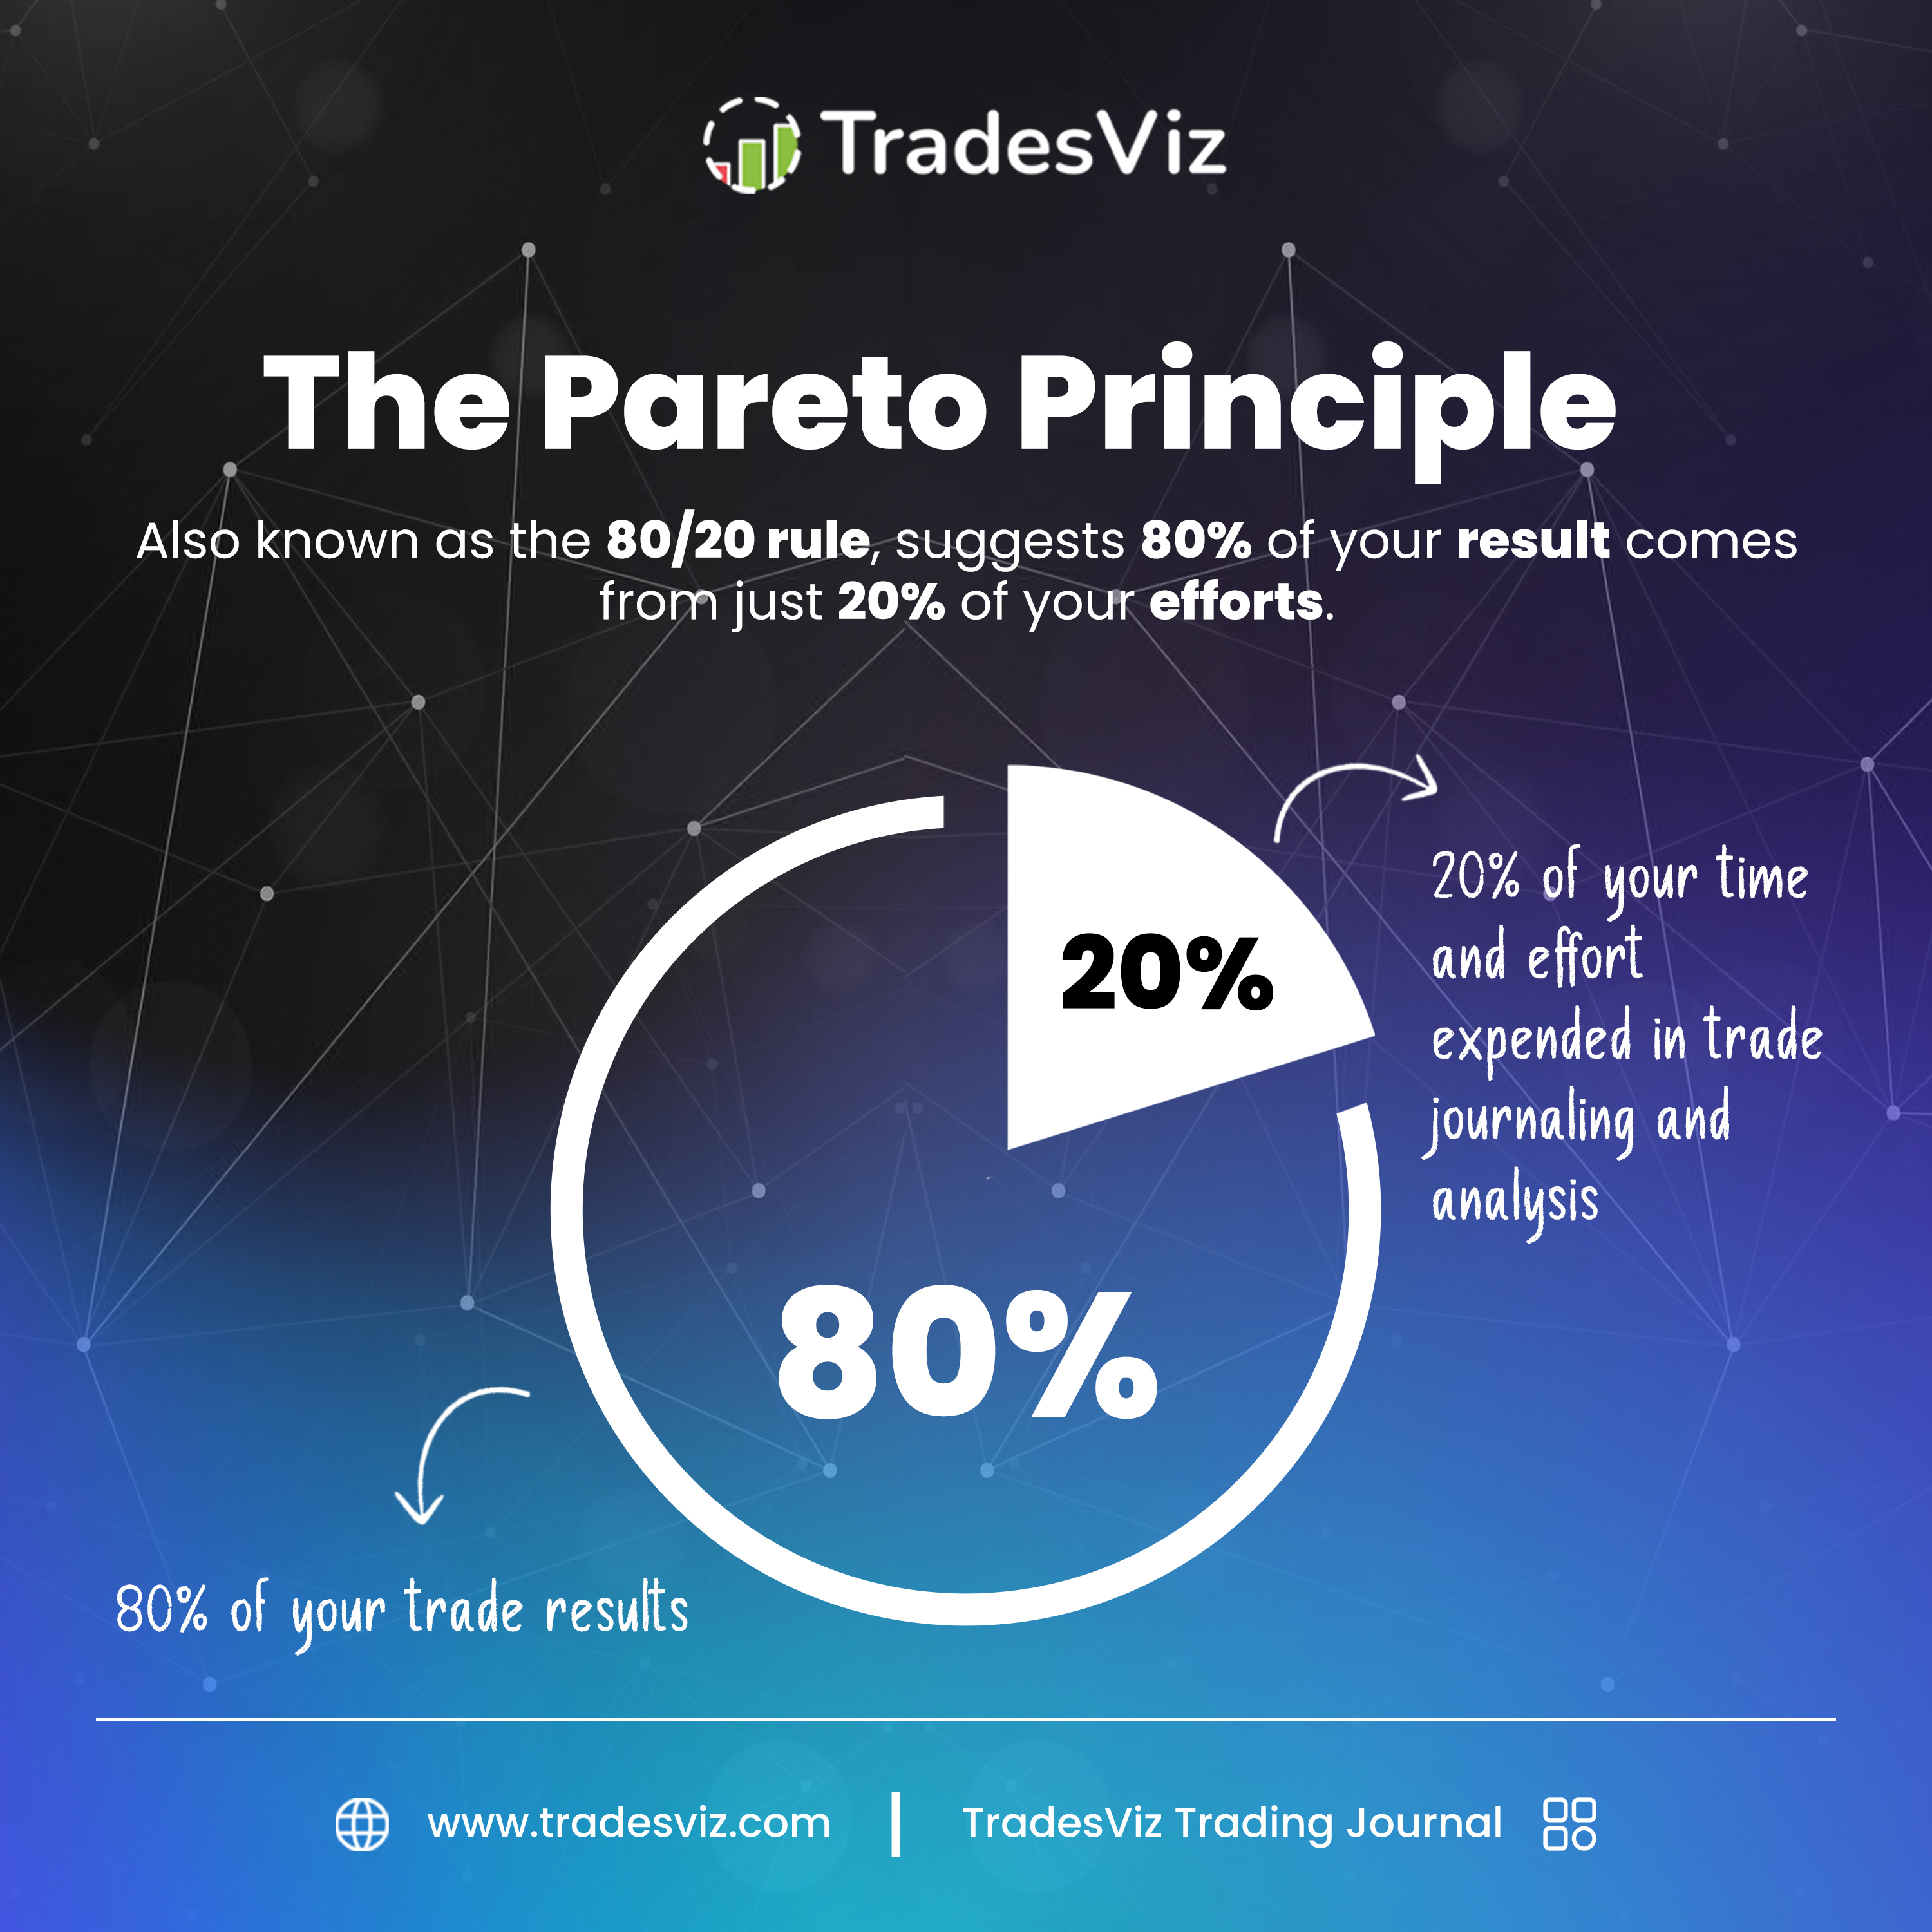
Trade journaling and trading analysis are time-tested practices that have existed for DECADES and make dedicated traders into very successful ones over time.
At TradesViz, our goal is to provide the cutting-edge version of this battle-tested practice to traders from all over the world. More than 80% of TradesViz's features are exchange/currency/asset agonistic, meaning you can add trades and analyze them even if we don't officially support the exchange you are trading in.
We realize this is a very long blog post. But if you did read most of it and get to the bottom, thank you. You are already ahead of most traders with your newly gained knowledge of effective journaling methods. What's left is for you to start importing your trades and start journaling on TradesViz. It's going to be a long, interesting, and very rewarding journey. 