TradesViz's monthly calendar tab has been one of the favored tabs of almost all types of traders as it's very versatile and you can explore different types of data in it. On top of this, we've also had weekly and yearly views both of which have provided users with different levels of visualization of trades.
However, when you want to view your daily performance summary, the only option so far has been the group-by-day table under the trades table. While this is extremely useful for quickly searching, filtering, and visualizing days using our grid charting features, it is still missing a lot of data that you would get when you visit the trade explore tab by clicking on a date in the calendar o by clicking on the calendar icon in the group by day table.
Today, we are introducing two features. The first is the day view/daily view tab and the second is a component that you will find really useful which is the running pnl chart for a given day. The day view tab is under the calendars section in the main dashboard.
Day view tab
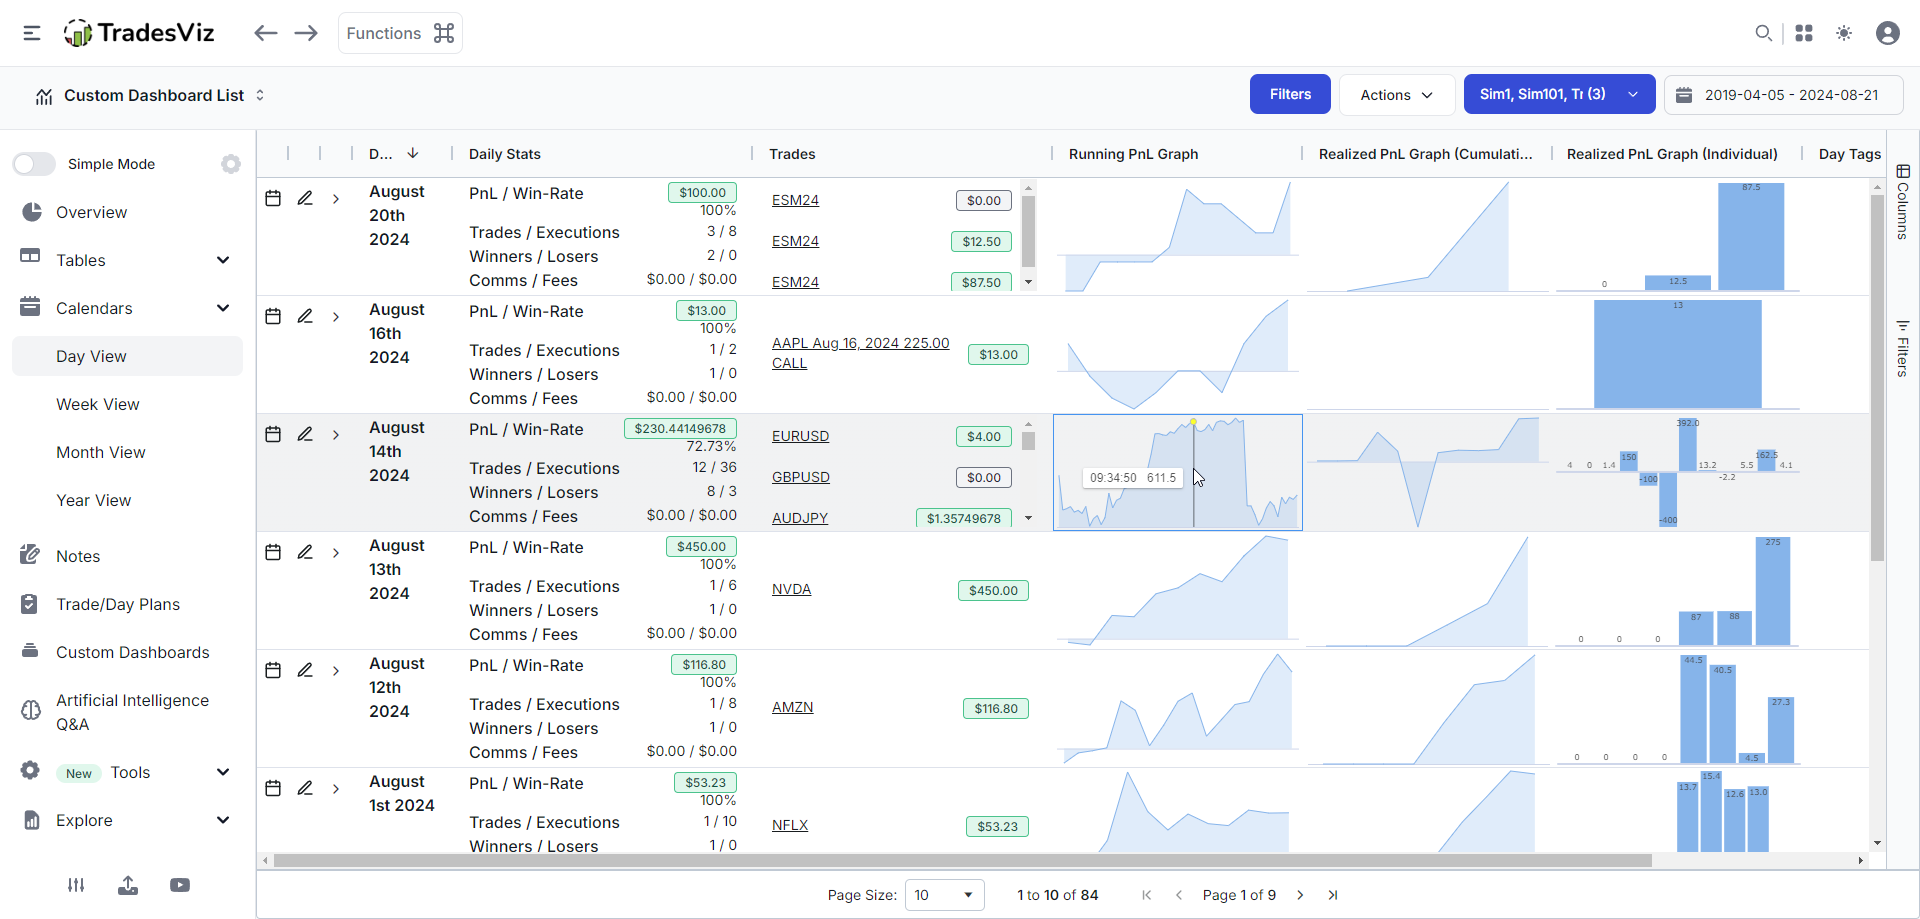
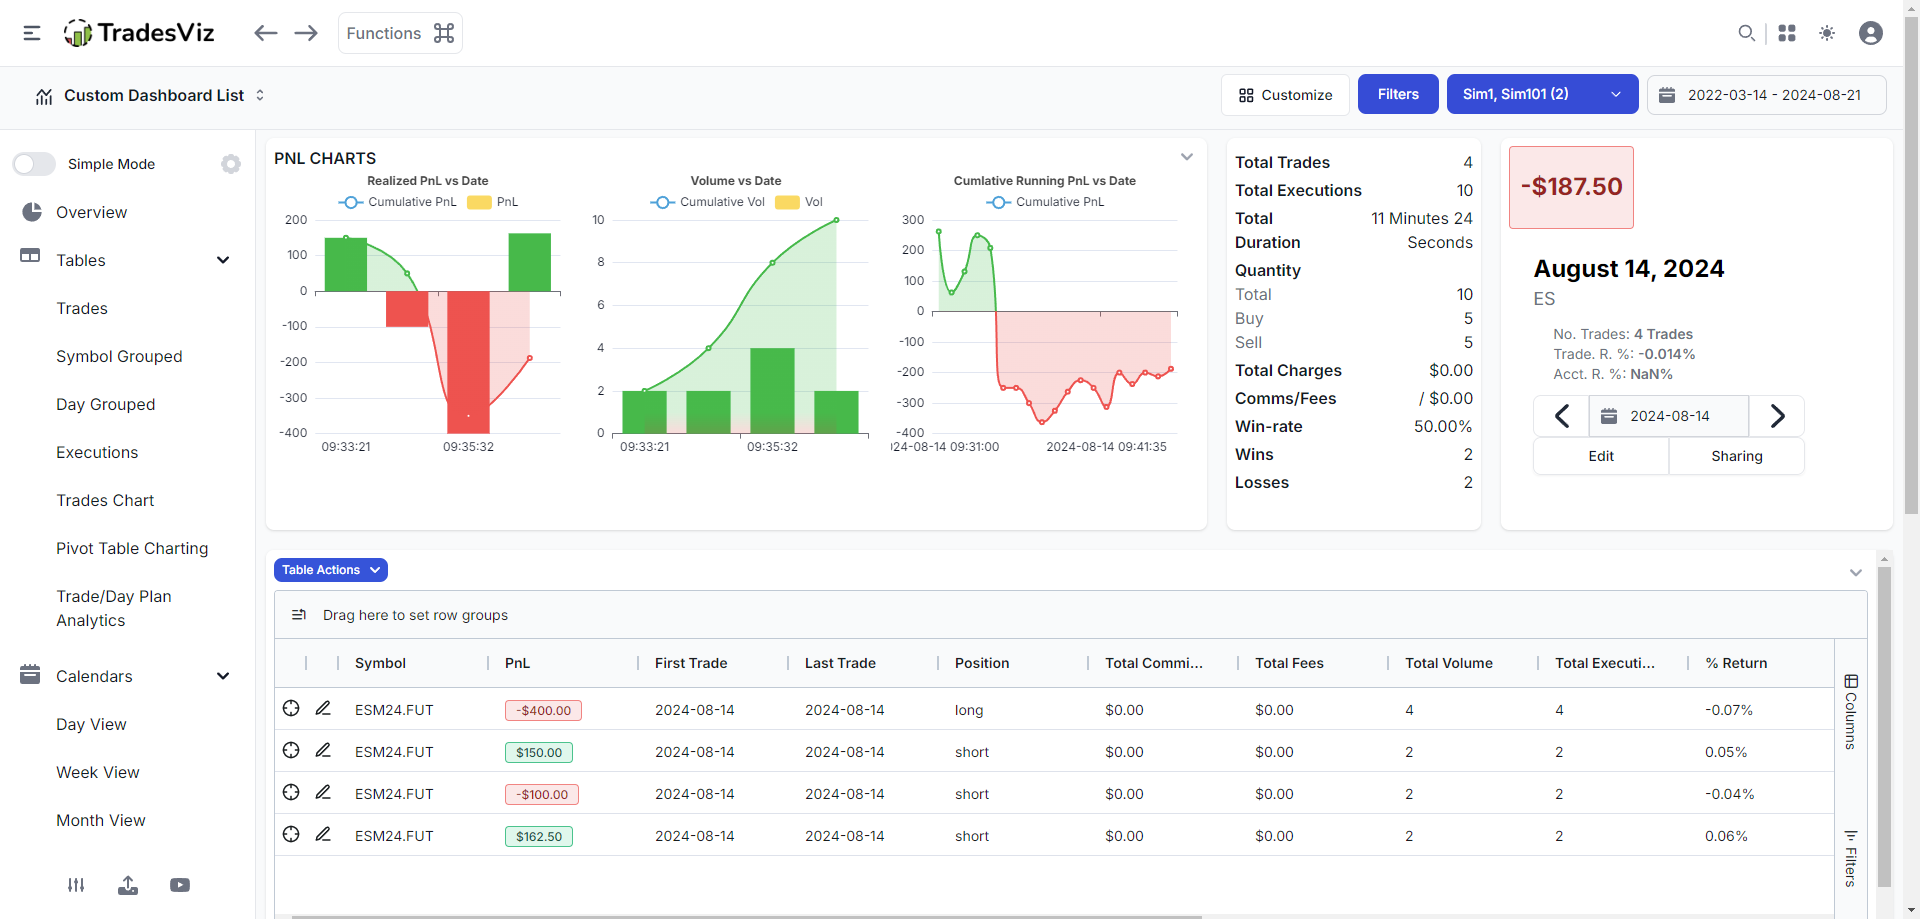
On visiting the day view, you will see a detailed table with charts in it (for the first time in TradesViz, we are starting to introduce built-in charts right from the table view itself):
Ok, let's break this down.
We've created a day view in the format of a grid because that makes more sense when you want to quickly filter/sort data. It's easy to list the charts and stats row by row without a table like in other journals, but that loses a lot of utility. The columns you will see are:
- Explore day button (calendar button): Used to jump to the day explore tab
- Edit day button (pencil button): Used to add/edit the day's notes (+ add templates) and add/edit tags.
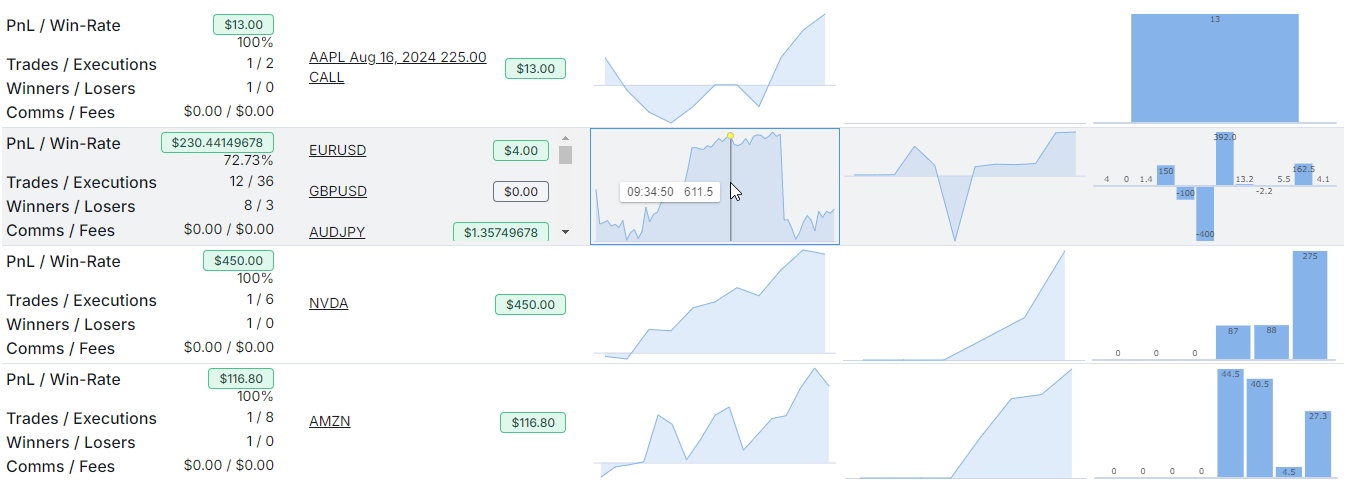
- Daily stats: All the essential stats of your trades for that day are neatly organized with each row showing two pieces of related information
- Trades: A list of clickable trades and their pnl where clicking on a trade (the symbol with the underline) will take you to the trade explore tab.
- Running PnL Graph: We introduced the concept of running PnL and related stats last year for individual trades. But this is for an entire day (constructed using running pnl of each trade of that day). More details and nuances of this are explained further down in this blog post.
- Realized PnL Graph (Cumulative): It will show you the cumulative total pnl of each trade made on that day as a line chart. Note that the difference between a running pnl graph and a realized pnl graph is that a running pnl graph will include unrealized pnl between each trade/execution whereas, a realized pnl is just generated when you close a position.
- Realized PnL Graph (Individual): This will show you the bar graph of each trade's pnl for that given day. Note that if only a single trade is made, you will instead see the trade's execution's pnl instead of a single bar (the same applies to the cumulative version also).
- Day tags and Day notes: For each day, you are able to add notes and tags which you can further organize, tag, and manage via the notes tab. The notes for a given day are displayed here. Note that these are NOT the notes made on the *trade* for that day. Those are trade notes and we will try to add other columns based on user feedback to this table in future updates.
Along with this, you will also see max realized pnl, which is the maximum drawup (max through to peak distance) and min realized pnl, which is the minimum drawdown (max peak to trough distance).
If you want us to add more columns or if you have any ideas/feedback on how we can improve this, let us know by emailing us at [email protected]!
The columns of interest for most traders would be the charts in each row. It's fully interactive meaning, you get to know the exact pnl at each moment of the day just by hovering your mouse over the charts.
Another feature that we've carried over from the group by day table is the ability to expand each row to display the trades made in detail.
Daily running pnl
Now let's explore a little bit about the running pnl for a given day.
About running pnl for each trade:
- Running PnL is shown for each trade at the bottom of the trade explore page
- This feature is available for all asset classes: stocks, forex, cryptocurrency, CFDs, single-leg option trades, and futures.
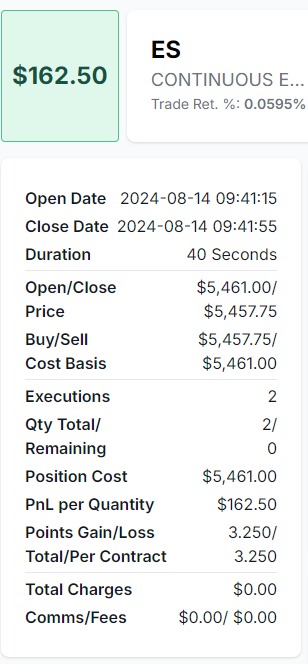
- For futures, we use sub-minute data (5-sec resolution) to show running pnl at the most detailed level and TradesViz is the only journal to do so making TradesViz the best fit for intraday futures scalpers. Another feature exclusive to TradesViz: the only trading journal to show unrealized pnl and running pnl graph for all US/IN options.
- Running pnl is automatically generated on import and it can be generated by recalculating a trade also. Also, simply visiting a trade generates and stores the running pnl in your account.
- If running is not visible or not available, it means :
- The trade's symbol is unsupported or unrecognized (if unrecognized, click on edit and assign a symbol tag)
- The trade is an options trade with multiple strikes/expiries (running pnl for these cases is being worked on)
- The trade is just imported - meaning, we don't have the data for it yet and so you can check it the next day
- There are advanced stats generated for running pnl based on trade unique to TradesViz
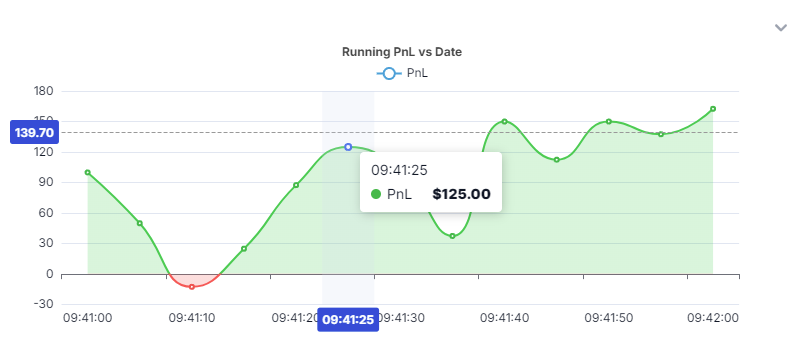
The example below shows running pnl in a sub-minute timeframe for a futures trade where the total trade duration itself is only 40 seconds.
 |
 |
To construct the daily running pnl, we combine all the trade running pnl of a given day and show it as a graph in the day view table. The same running pnl can also be viewed in the day explore tab like below.
Here's a zoomed version of the cumulative running pnl chart:
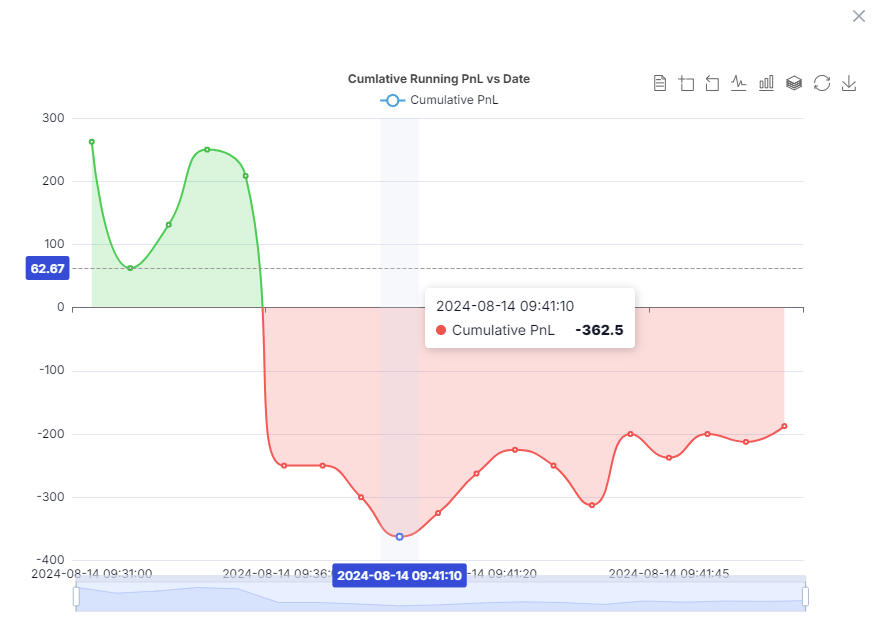
Oh... did you notice something different in the day explore tab above? We've customized the day explore tab to emphasize the chart and table on the first page fold by using the grid customization view.
Caveats and limitations
Note that ONLY the trades that are fully opened and closed for a given day are used for the calculation of running pnl of a given day. This means, that if the running pnl of a trade is missing, or if the trade spans more than a day only the available running pnl will be used and thus, the end result may not match the total realized pnl for the day. This is very important to understand.
For example, if you have a multi-leg options trade and a stock trade on the same day, only the running pnl of the stock will be used because there will be no running pnl generated for the multi-leg option trade as we don't support it yet. However, the day's realized pnl will include the sum of both the trade's pnl.
As with all features, improvements will eventually overcome the limitations and your feedback will also greatly help point us in the right direction on how we can better help you navigate and visualize your trades.
We really hope you like using this new tab! This day view tab of TradesViz makes daily/weekly trade reviews more efficient than any other journaling solution. As always, TradesViz aims to be the leader of online trade journaling and analytics and this is just one small step in the direction of data accessibility and efficiency. Let us know your feedback and opinions by emailing us at [email protected]!