In the last 4 years since our inception, we've branched from just simple journaling to one of the most robust financial platforms in the world for traders from many countries.
Simple journaling turned into ultra-flexible dashboards, 600+ analytics, the world's first AI-based Q&A, and more. After that, we started introducing simulators. Once again, TradesViz becomes the world's first and only trading journal capable of simulating EVERY asset class - stocks, options, futures, forex, crypto, and more using a universal trading simulator.
Next, we introduced tools to help augment your trading. This included options payoff charts, options flow scans, market overviews, fundamentals visualizations, backtesters, and more.
All of these are features the users of TradesViz have been getting access to and using regularly since our launch. Remember that we're still primarily an analytics platform at heart, but we also want to provide maximum value to traders who open TradesViz every day before/after their trading.
To improve the value provided, we roped in the power of EZstockscreener.com into TradesViz allowing traders to access over 30 unique screener results across 4 countries (US, India, Canada & Australia) every single day.
This is our latest addition to the tools section of TradesViz: Daily stock screener results
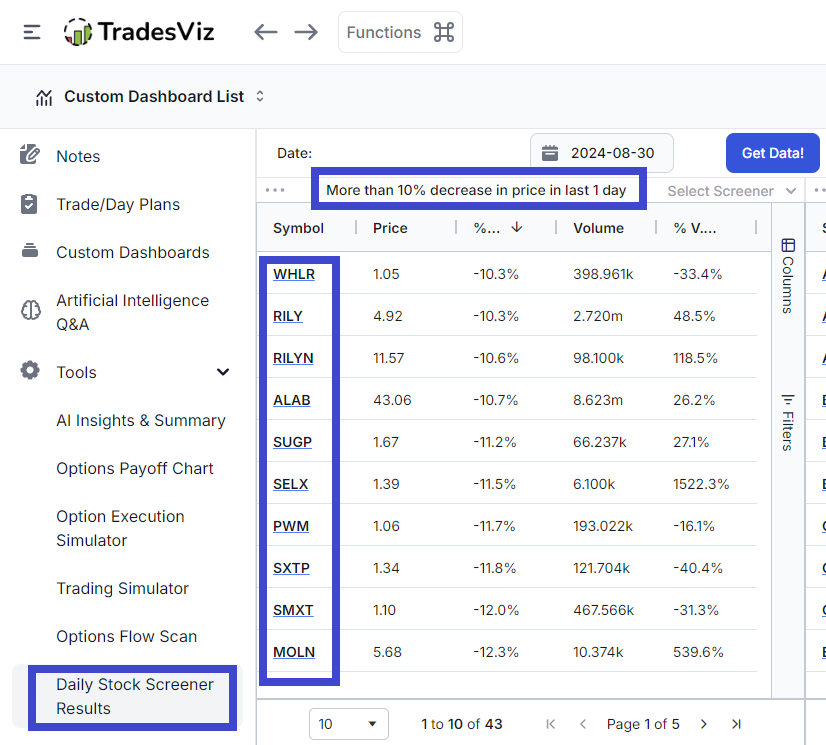
You will be able to find this new tab by visiting the Tools sidebar in your main dashboard (and selecting "Daily stock screener results") or in the Applications button at the top right corner (and selecting "Daily screener"). When you first launch the tab, you need to click on "Get data" or select a date you want the screener results for and then click on Apply in the calendar.
For example, if the current day is 30th Aug 2024, you will see screener results based on EOD data of 29th Aug 2024 and before. None of the results include any pre- or post-market data-based screening. Results are all based on 1-DAY/DAILY OHLC chart data.
The main function of this tab is to show you the most interesting stocks to trade or at least look at every day. For now, this is limited to stocks only - BUT, we have enabled it for all of the exchanges from the countries we support officially - US, IN, CA & AU.
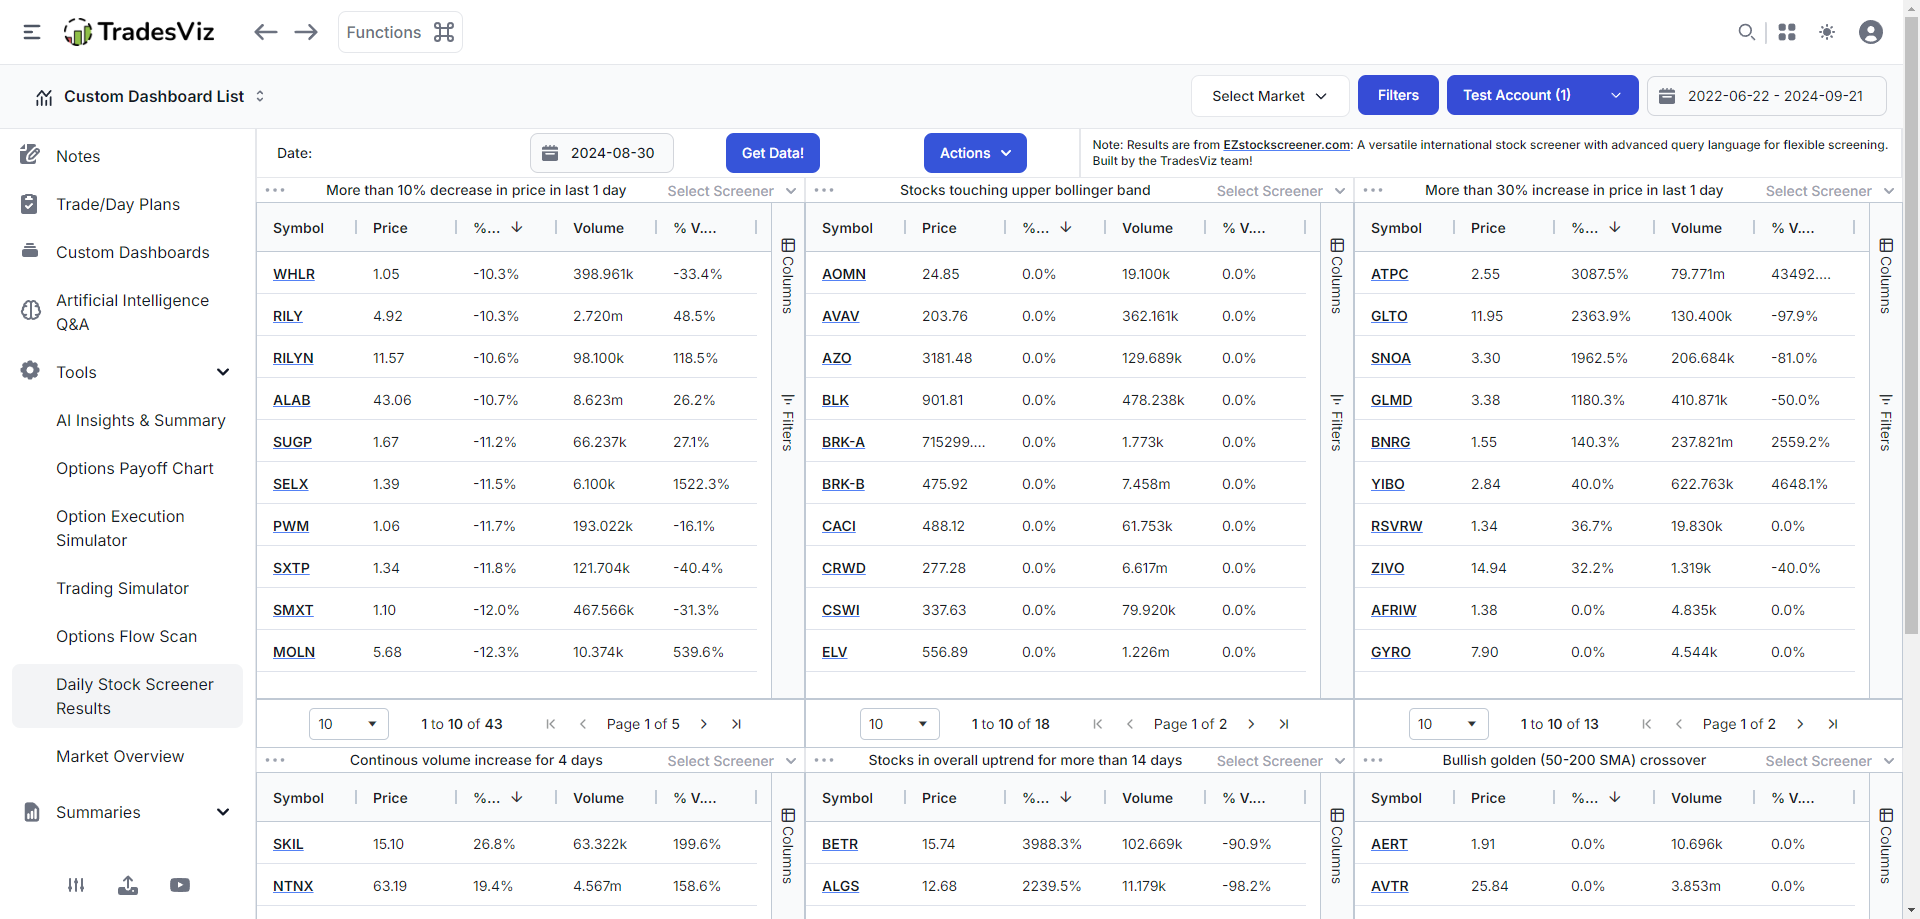
You can easily switch between countries by clicking on the "Select Market" dropdown at the top.
Next, you can view 6 unique screener results at the same time. All of these are the grid tables we use in the other tabs of TradesViz so they are as powerful as they can be when it comes to filtering and customization.
For each section, you will see the 3 dots icon at the left top corner (to make changes to the table) and then the title of the screener followed by the screener selection.
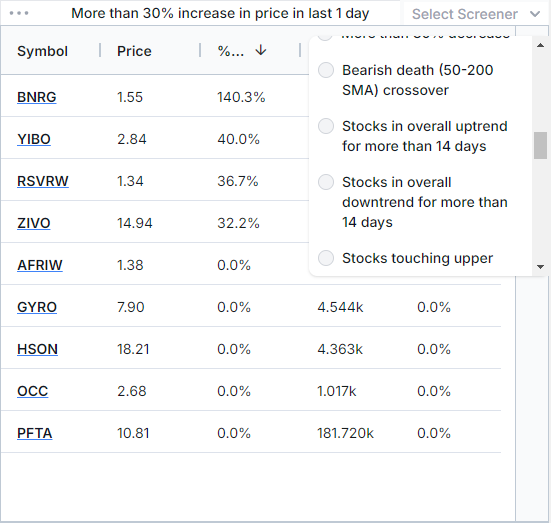
Totally, there are 30+ screeners available as of now. They are listed below:
- More than 10% increase in price in last 1 day
- More than 20% increase in price in last 1 day
- More than 30% increase in price in last 1 day
- More than 10% decrease in price in last 1 day
- More than 20% decrease in price in last 1 day
- More than 30% decrease in price in last 1 day
- More than 20% increase in price in last 3 days
- More than 20% increase in price in last 2 days
- More than 30% increase in price in last 3 days
- More than 30% increase in price in last 5 days
- More than 20% decrease in price in last 5 days
- More than 20% decrease in price in last 3 days
- More than 30% decrease in price in last 5 days
- More than 30% decrease in price in last 3 days
- Continuous higher highs + green for 3 days
- Continuous higher highs + green for 4 days
- Continuous higher highs + green for 5 days
- Continuous lower lows + red for 3 days
- Continuous lower lows + red for 4 days
- Continuous lower lows + red for 5 days
- Continuous volume increase for 4 days
- Continuous volume increase for 5 days
- Stocks breaking up with volume increase
- Stocks breaking down with volume increase
- Stocks in upward trend for 5 days
- Stocks in downward trend for 5 days
- Bullish golden (50-200 SMA) crossover
- Bearish death (50-200 SMA) crossover
- Stocks in overall uptrend for more than 14 days
- Stocks in overall downtrend for more than 14 days
- Stocks touching upper Bollinger band
- Stocks touching lower Bollinger band
These screener conditions are based on specific feedback from users of EZstockscreener and also based on general feedback from TradesViz users. We've tried to make sure that the list tries to cover both situations - bullish/bearish conditions mostly depending on price and not on any complex indicators so that everyone can understand and use the screener results.
Note that before you request a screener, please check www.ezstockscreener.com for a nearly infinite way to construct screeners. What you see is a tiny fraction of what is possible on EZstocksceener. In fact, the screeners are internally simply screener conditions on EZstockscreener. Example:
The syntax/language you see above is based on the query language we have for EZstockscreener. The screeners we have here can further be customized only via the table filters.
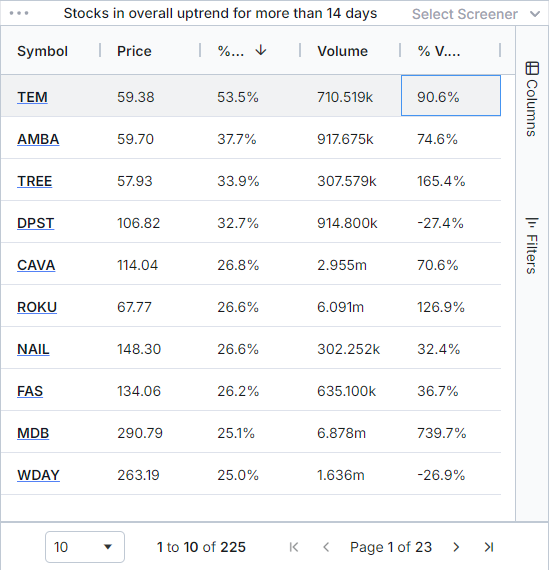
For example, if you are seeing too many results in a table, try to filter it down based on price, price change %, volume, etc.,
Before filtering by daily volume (total 200+ results) and after (total 15 results):
 |
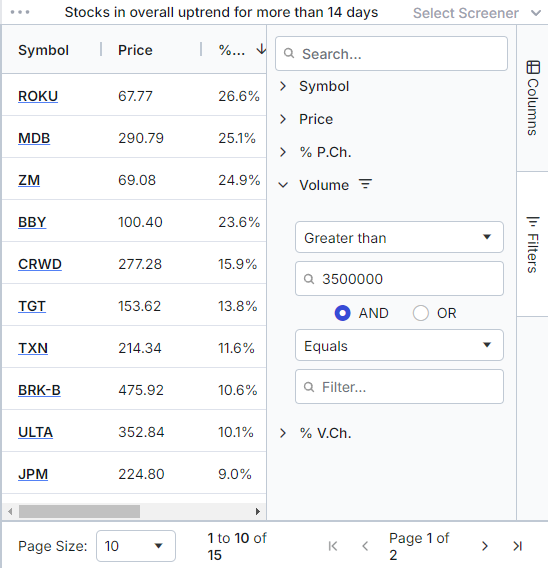 |
The goal is to find screeners you like, select them in each of the table's dropdowns, and then filter the table based on your requirements and save the table by clicking on the 3 dots icon > Save state.
This means you can open TradesViz, check your screener results, start making notes, and trade plans immediately when you start for the day.
You might have noticed that the symbols are underlined in blue - in all parts of TradesViz, this underlining typically means the element can be clicked. In this case, clicking on any symbol in any table will show a delayed chart at the bottom of the page.
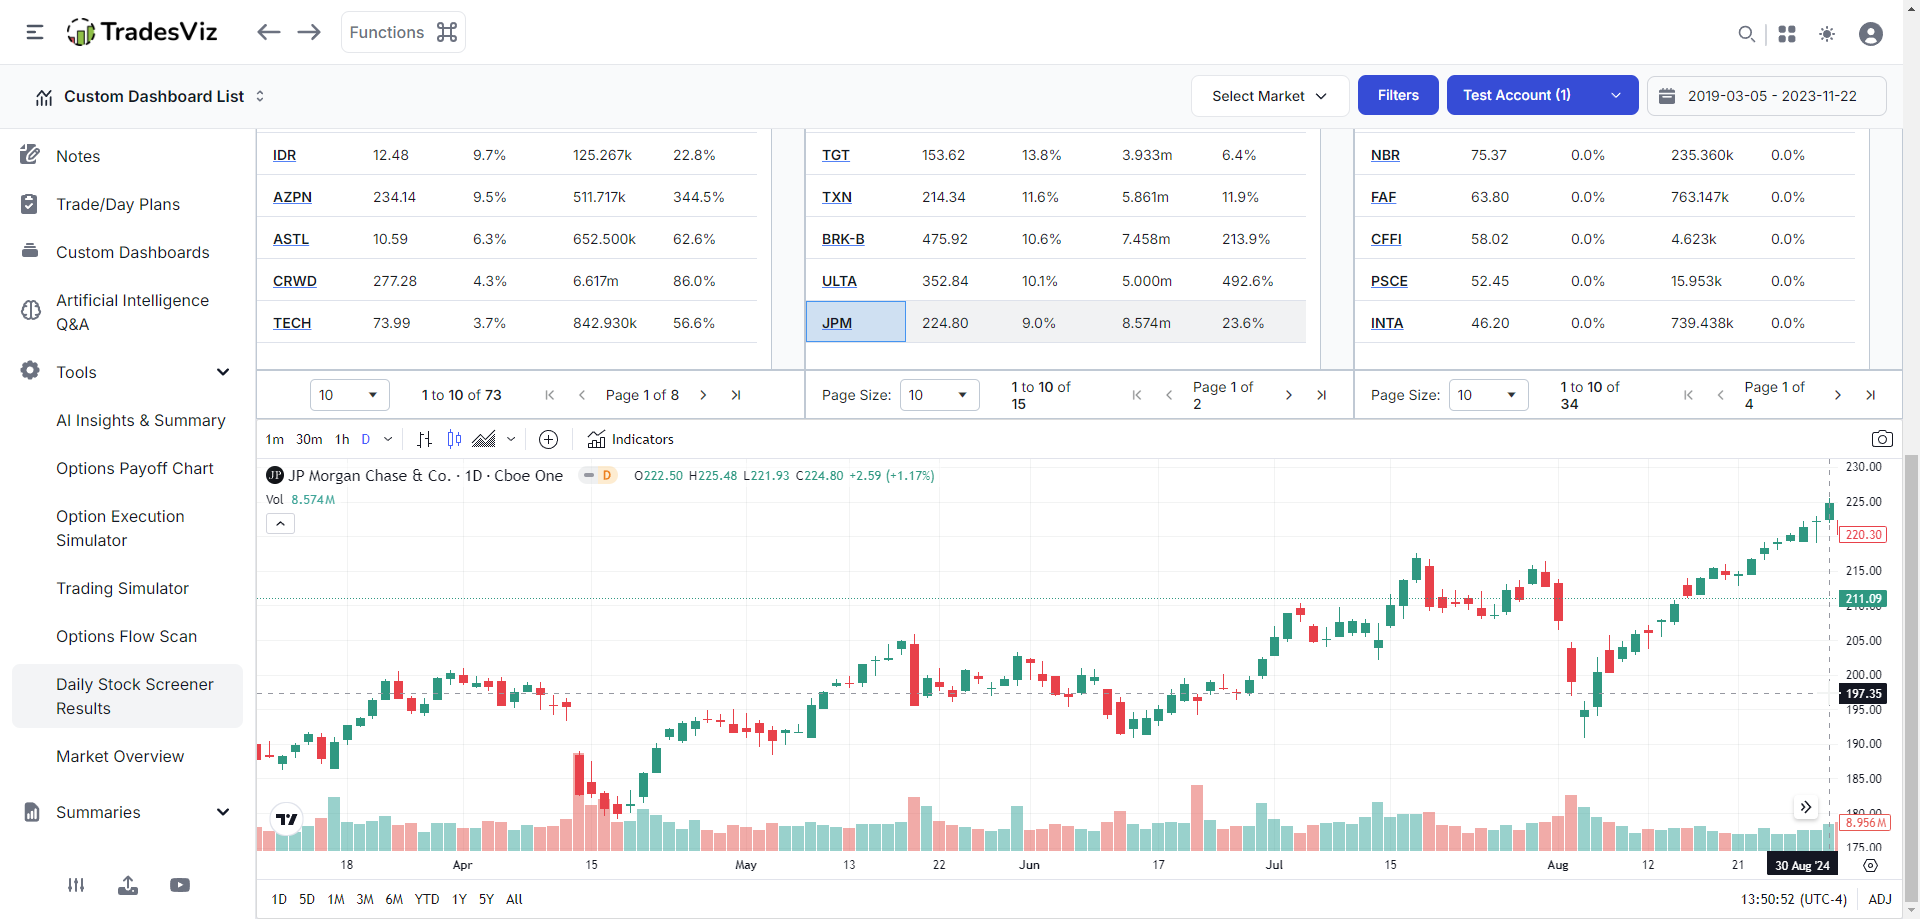
The above is the result after clicking on the JPM symbol in the table right above the chart. Once again, this is applicable to every single symbol you see in any of the tables.
Finally, we didn't forget about the connectedness attribute of the features of TradesViz. We keep saying this: "everything is connected in TradesViz" and other tabs are indeed connected to the daily screener tab as well. How?
Try clicking on the Actions button.
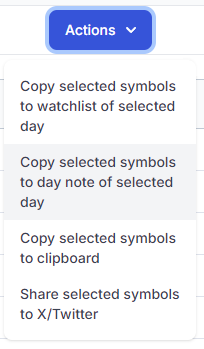
You can click on any symbol on any page of any table(s) and use one of the actions more apt for your case. If you just want to create a watchlist in your day explore view, add these selected symbols in a single click. Maybe you just want it as a note in case you want to edit it later on to add more context? No problem at all. What if you found something REALLY interesting and want to share it with your friends - use the share selected symbol to X/twitter and your selection can be seen by everyone in X/twitter. All of this requires a single click.
There is a lot more we can do here - like adding options flow shortcuts or more charting options, more indicators, adding your own saved EZstockscreener screeners + more. All of this depends on how you want to shape the direction of our development. We want to hear from you. Email your opinions, thoughts, feedback, and ideas to [email protected]! Your feedback matters and we've shown that many times over the year by implementing exactly what our users ask us for!
We hope we have made TradesViz useful to you in your pre-market analysis for more than just planning with this feature.
There's a lot more in store in the upcoming months/weeks! Stay tuned for more updates!