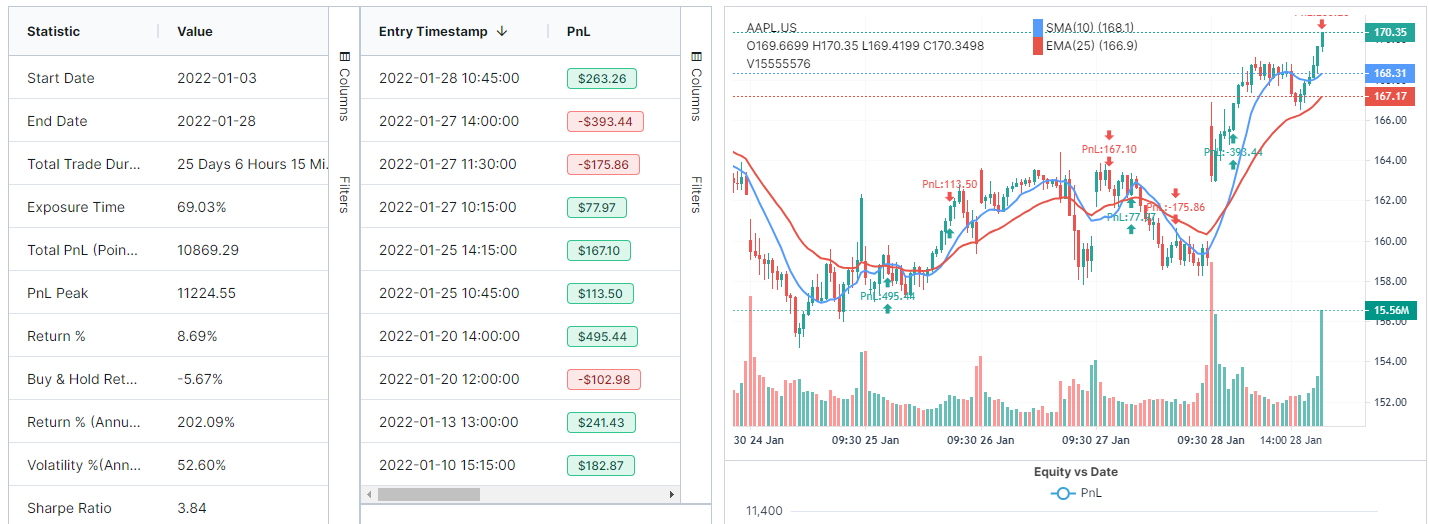
Since the inception of TradesViz, we have tried to add many useful tools that are mostly outside of the journaling area to provide additional value to our users. In this direction, we have added options flow analytics & screening, fundamentals, seasonality, and trading simulators making TradesViz the most valuable retail FinTech tool for any trader from any market.
To add to this list, we are now extending our feature list to include a long-requested feature: Backtesting!
We have built and continued to maintain our international stock market screener EZstockscreener.com for almost 2 years now and it has served a lot of traders in finding useful stocks to buy and hold. As the screener's logic and core built for EZstockscreener is so versatile and generic, we thought we'd make use of it by creating a backtester with the same indicator query engine as EZstockscreener.
How to use
Click on the 3 lines icon at the top right corner of your dashboard and click on "Backtester". Alternatively, you can access it directly via this link: https://tradesviz.com/backtester/. Once you are on the page, you will see the backtesting console that consists of 5 sections.
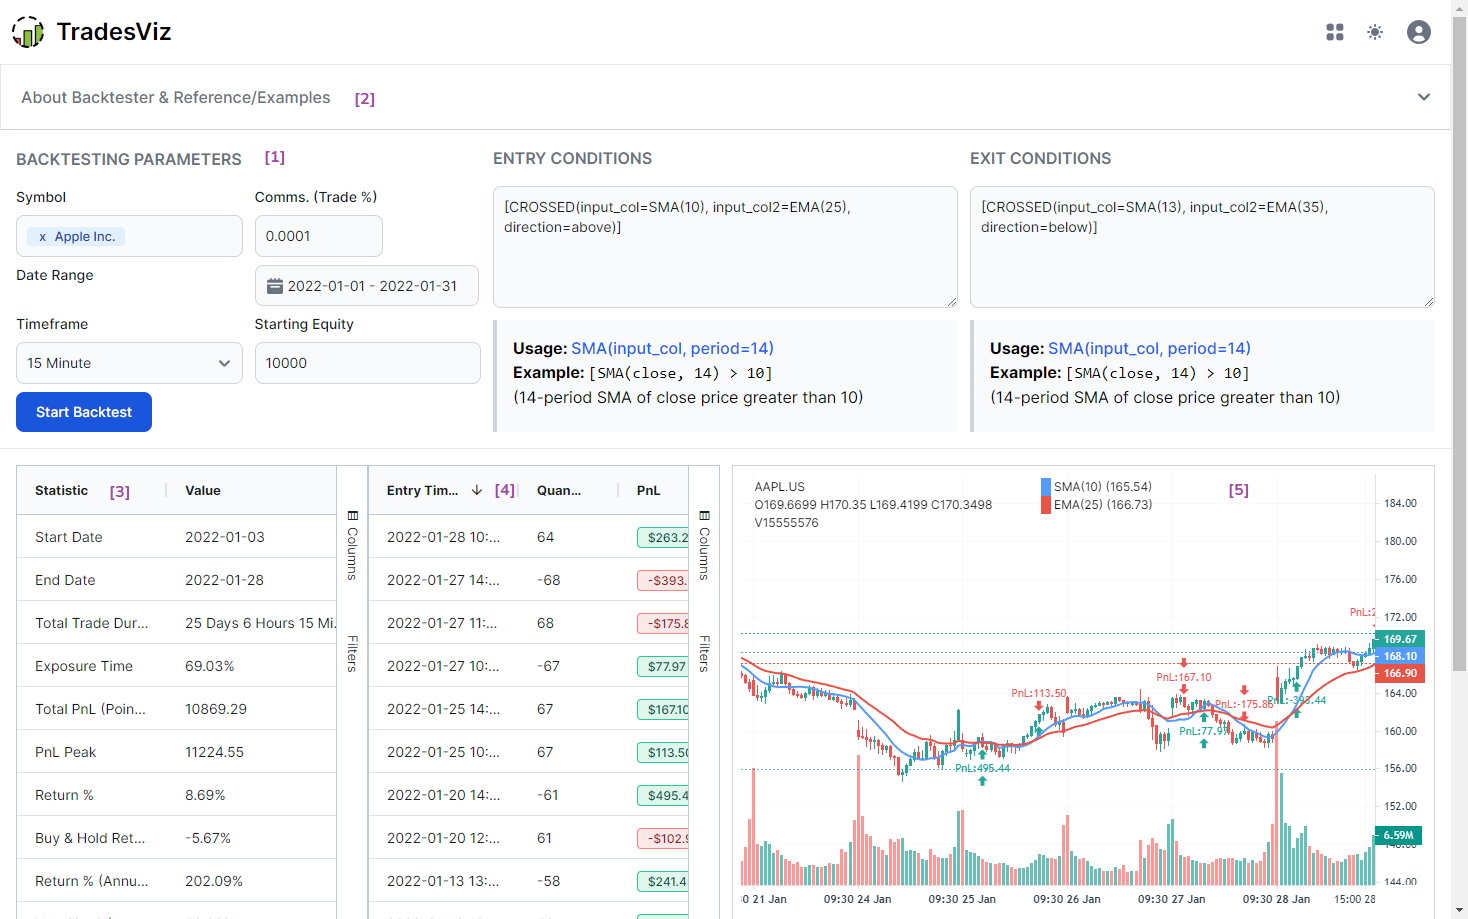
- Backtesting parameters & entry/exit conditions
- Indicator references and examples
- Backtest results & summary
- Executed Trades list
- Plotted chart (OHLC charts + markers of buy/sell + ALL indicators) & Equity curve
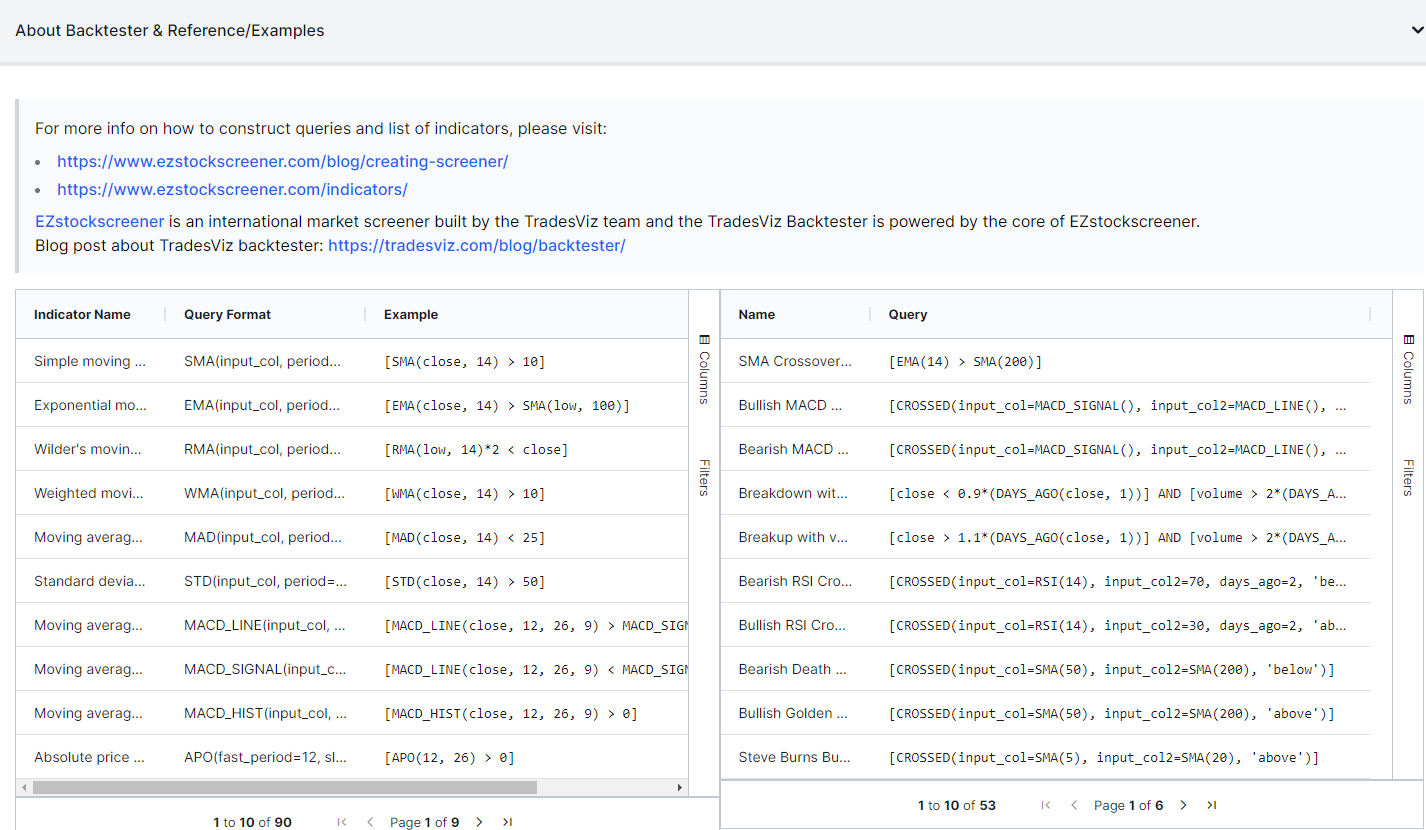
Your focus will be mostly on the entry/exit part of the backtesting parameter section where you will be constructing queries using the EZstockscreener query language. For more info on how to construct queries and a list of indicators, please visit: https://www.ezstockscreener.com/blog/creating-screener/ and https://www.ezstockscreener.com/indicators/
Other than the entry/exit, you are able to choose pretty much ANY symbol from our database - this includes stocks, futures, and indices from the US, CA, AU & IN. Note that for any leveraged instrument like futures, only the point value will be presented - not the multiplied currency value. This is to make backtesting simple and easy to compare across many different types of symbols.
You are also able to assign commissions - this is not a fixed commission at the moment, but rather, a % of the trade input value. A very small value of this can also be used to simulate slippage.
One of the highlights of this backtester is that you are able to backtester on timeframes from 1 minute to 1 day - i.e. intraday and EOD backtesting is possible! However, at the moment we have limited intraday backtesting to only 1 year - this limit will be relaxed as we get more feedback and make the systems more efficient. The data used for backtesting is split and dividend adjusted.
Starting equity is important because each time, the entire capital is used in the position. So if you are backtesting, ES futures with 1k of capital, you are not going to see any results. Keep this in mind when backtesting expensive symbols. More advanced positioning, stop targets, etc., are planned and will come soon to the backtester.
Use section [3] - the indicator reference to check what indicators you can use and how to use them. This is extremely helpful and it's a searchable list of 70+ indicators and 50+ examples.
Sections [3], [4], and [5] are generated automatically when you click on the "Start backtest" button.
Parameters and Indicator Building
We will not be going in-depth into indicator and entry/exit building in this blog post as it's discussed in detail in the EZstockscreener blog posts:
PLEASE read these as they are essential if you want to build reasonably good backtests that can be applied to real trading. It's an extremely flexible system that can be customized like no other backtester.
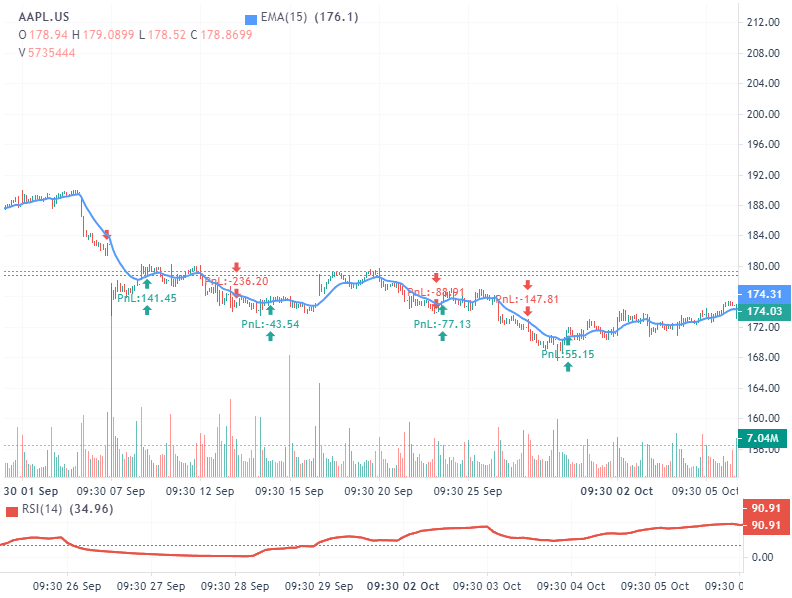
Here's an example of an entry indicator trigger where EMA(RSI(15)) crosses above 10. Sounds crazy? Yes, it indeed is. But this is a demonstration of just how flexible the EZstocksceener query system is compared to any backtester - and now you have access to that in TradesViz itself. Here's the entry/exit chart for the above crazy indicator:
Here's a more normal example of a 20-5 EMA crossover backtestet:
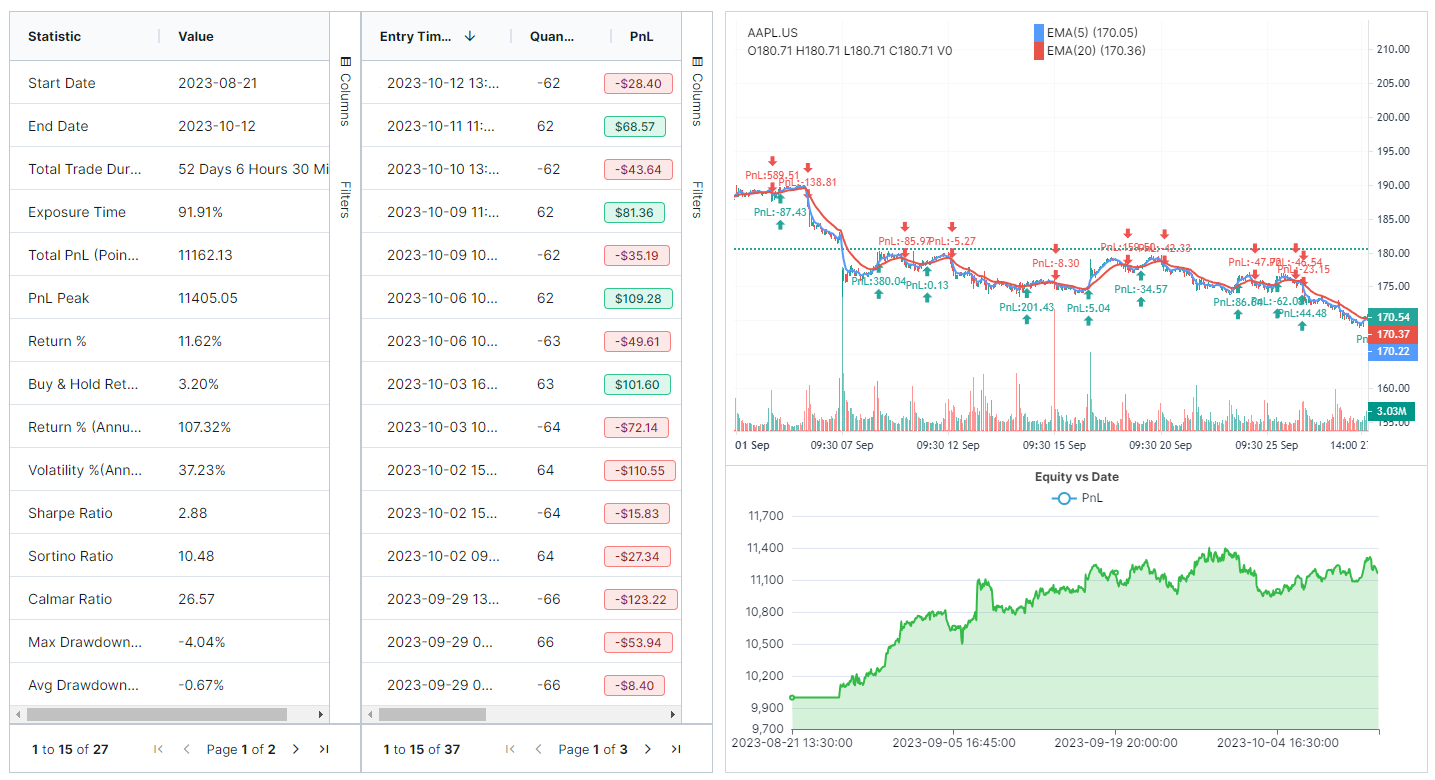
Typically, only the indicators that you mention in the entry/exit query will be drawn on the chart.
But here's a neat trick: You can enter a condition that always returns TRUE as part of your entry query if you want to visualize other indicators. For example, executing the below query:
and [F_ABS(rsi())*0 >=0]
and [F_ABS(cci())*0 >=0]
will result in something like this:
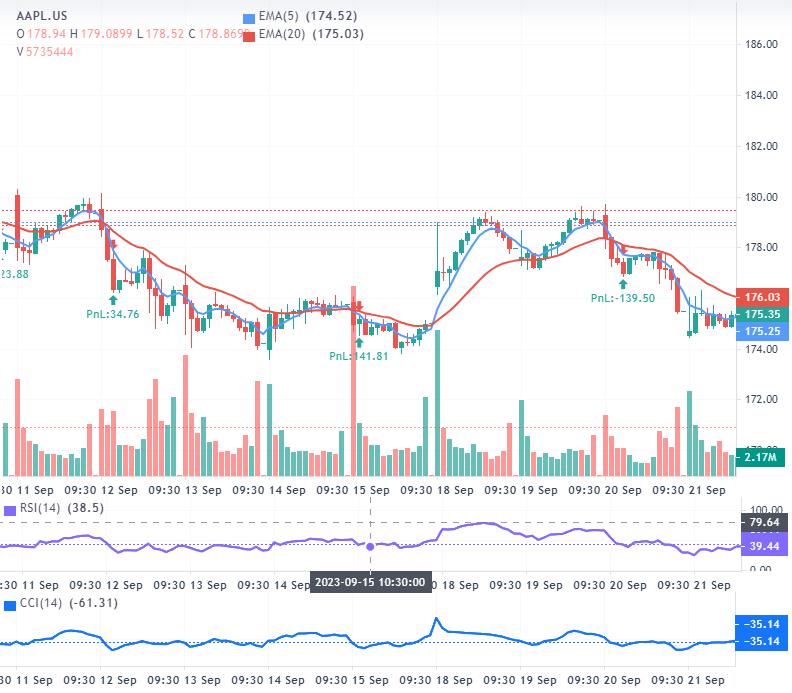
Note how the CCI and RSI play no role in the entry or exit, but they are still printed.
In the entry section, we are simply manipulating the indicator such that its condition always returns zero - F_ABS() is a function for returning the absolute value of any indicator series - many similar functions are available so be sure to check the indicator list from EZstockscreener!
Like how we have used simple arithmetic, you can also do complex arithmetic by using any operator (+,-,*,/) between any 2 numbers or indicators or a combination of both!
This is no mere backtesting where you just select from a list of indicators and choose above/below etc., - this is pretty much a backtesting engine with its own powerful query language.
Result interpretations
From the backtest result section, you will able to see important statistics such as:
- # Trades
- Win Rate %
- Total PnL (Points)
- Return %
- Buy & Hold Return %
- Sharpe Ratio
- Sortino Ratio
- Calmar Ratio
- Profit Factor
- SQN
- Drawdown %'s
etc.,
The equity curve shows the running PnL curve through the backtesting period - it is not like the PnL chart you see on the home page of TradesViz where the pnl is only shown on the close or open of trade, rather the entire movement of the symbol is shown in this backtesting curve. Hover your mouse over any part of the curve to check the pnl at that point. You can also zoom the chart by clicking on any empty area in the chart.
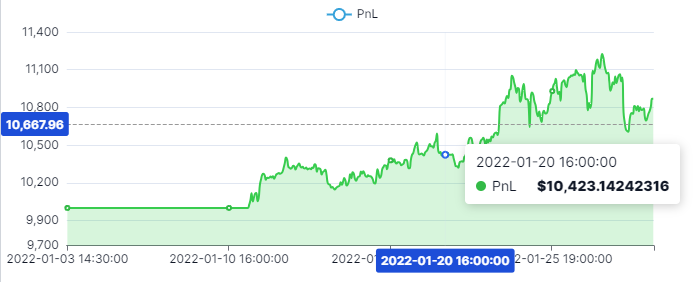
The cure is very important because it shows something very crucial in backtests: drawdowns.
Make sure to study the various drawdowns %'s as this is one of the pitfalls of the backtesting by just looking at win-rate and total pnl.
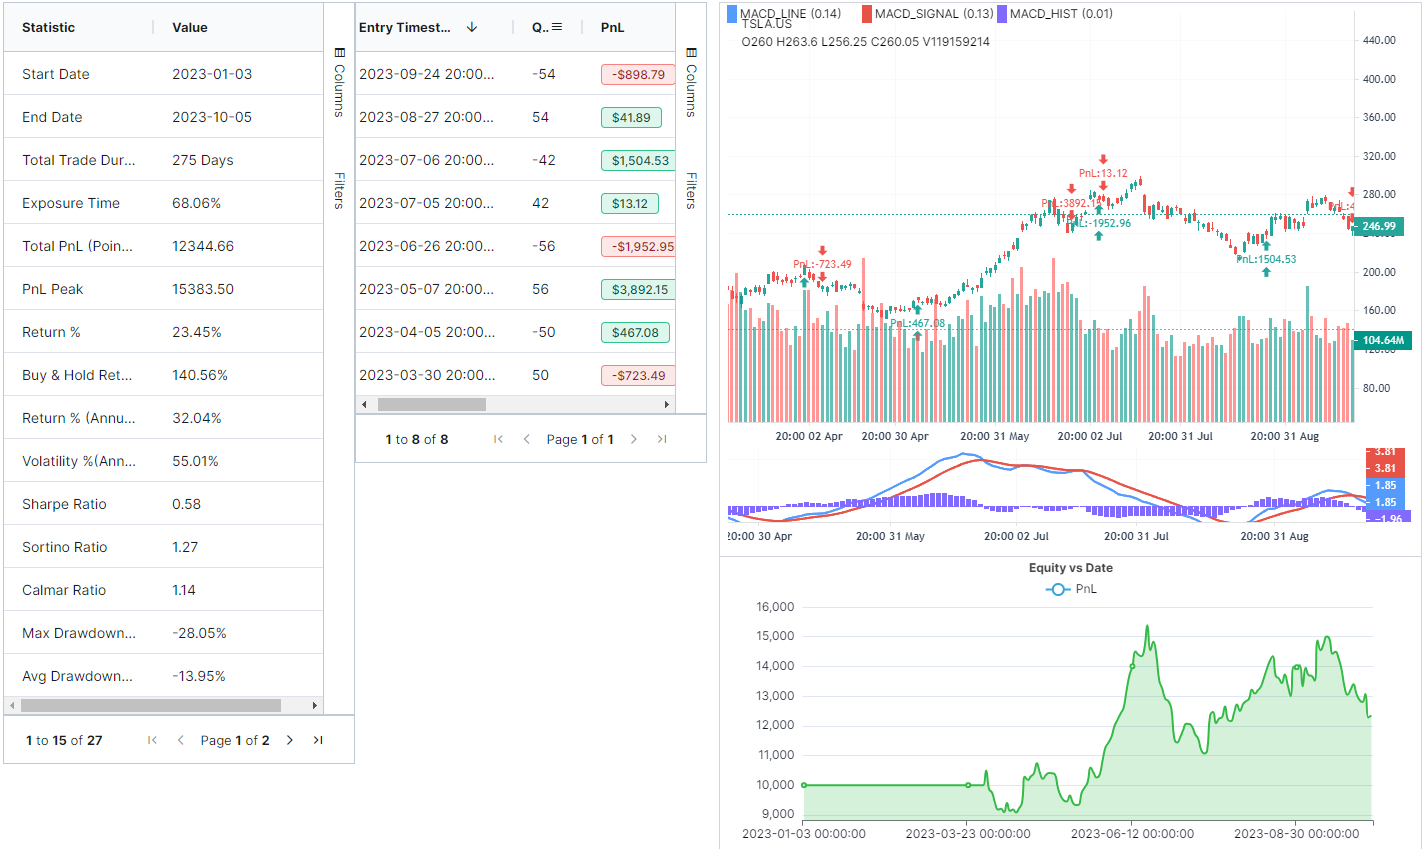
More examples of backtests with different indicators on different timeframes using different markets:
Timeframe: 1 day
Market: NYSE (USA)
Ticker: TSLA
Strategy: MACD crossover
Entry condition:
[crossed(input_col=MACD_LINE(close, 12, 26, 9), input_col2=MACD_SIGNAL(close, 12, 26, 9), above)]
Exit condition:
[crossed(input_col=MACD_LINE(close, 12, 26, 9), input_col2=MACD_SIGNAL(close, 12, 26, 9), below)]
Strategy Results:
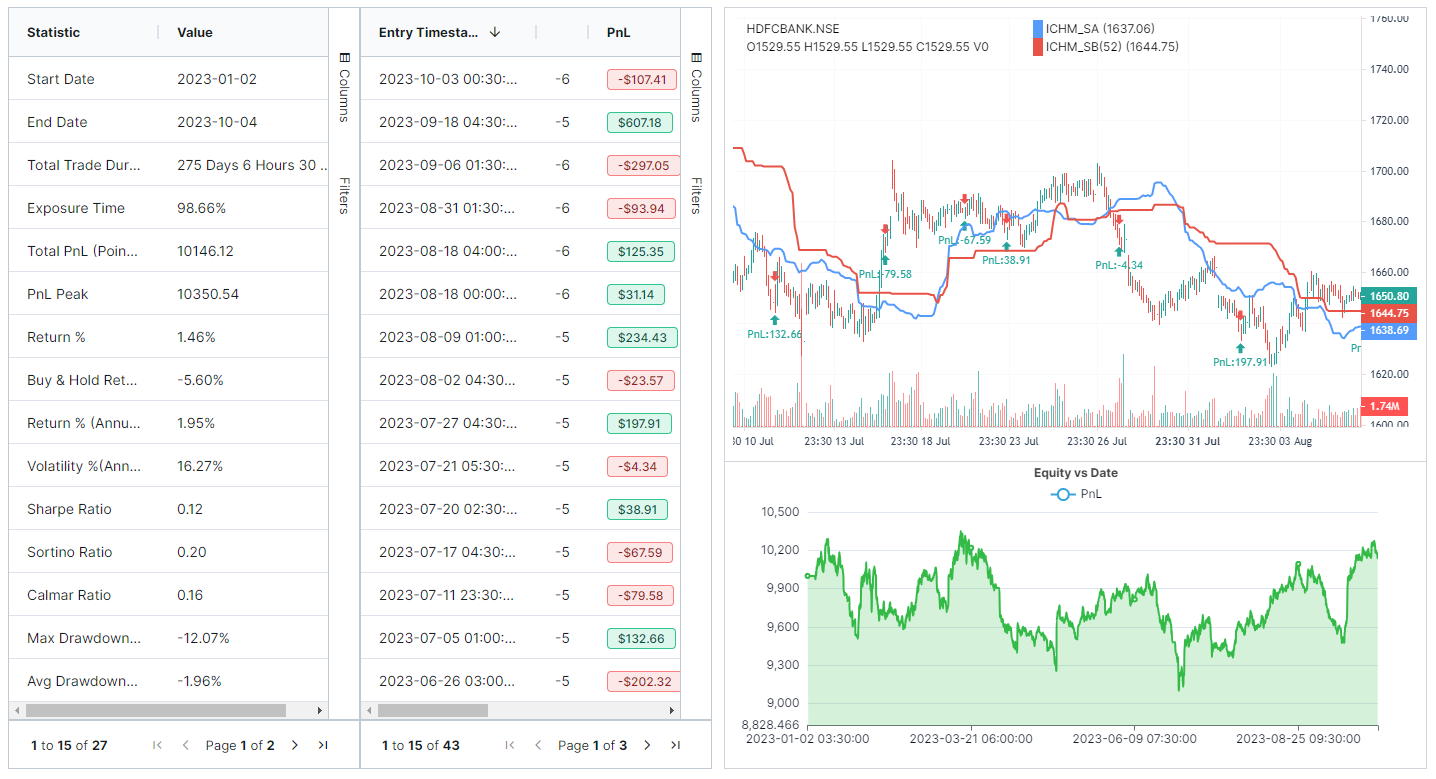
Timeframe: 30m
Market: NSE (India)
Ticker: HDFCBANK
Strategy: Ichimoku Cloud crossover
Entry condition:
Exit condition:
Strategy Results:
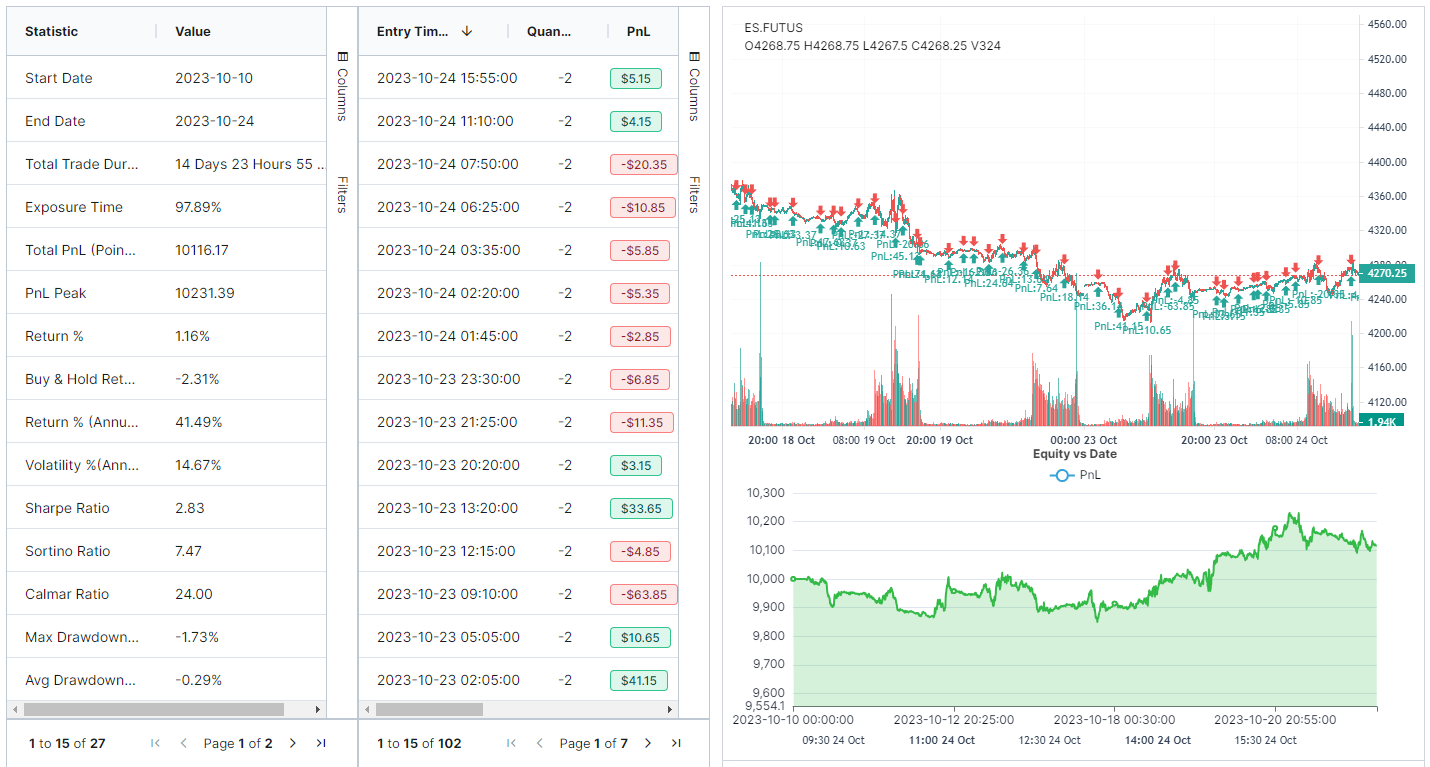
Timeframe: 5 min
Market: CME (USA)
Ticker: /ES (futures)
Entry condition: Simple MACD + RSI + ATR condition
and [MACD_SIGNAL(close, 12, 26, 9) < -4]
and [rsi(20) > 40]
Exit condition:
Strategy Results:
Unlike the simple back testers you've seen elsewhere before, the EZstockscreener query language allows you to get really creative with the queries. Use this to your advanced to backtest on different timeframes, with different indicators to find a strategy that works for you.
We hope this serves as another useful tool in your trading toolkit belt to effectively change/modify your strategy as and when required in these difficult markets. In the upcoming updates, we hope to launch features such as multi-symbol backtesting, stop/target level adjustments, more precise and easier way to build and write queries.
Let us know your feedback by sending us an email at [email protected]! We still consider the backtesting feature to be in an open-beta stage as it's something that's very different from what we have done before. Your support and feedback is always highly appreciated!
