Artificial Intelligence (AI) has been an important part of TradesViz since 2023, when we first launched the AI Q&A - the first time any online trading journal has had a useful AI agent to help analyze and explore data. This holds true even now. There's no other journal that has any useful competent of AI other than for the sake of "marketing".
We didn't just stop there but expanded and continually improved the quality of our AI query processor, which now has so much effect that most users using the custom dashboard on TradesViz have 30% of their widgets as AI widgets.
After the AI Q&A feature, we launched AI-powered trade notes summary and AI-powered daily summary, which has helped traders add a great level of detail into their trades in a fully automated way.
All of these features have had a significant increase in usage over the last year. Now, we want to do more for our users as we clearly see how much of a positive impact AI is having on traders.
This time, we're not focusing on your trades but on improving your knowledge. How?...
We're introducing the "Fundamentals AI Q&A" which will be a part of the AI Q&A tab. This will work exactly like the trade AI Q&A, but the query processor is optimized and built to answer questions about companies (stocks) from all over the world based on their fundamental data (current and historical).
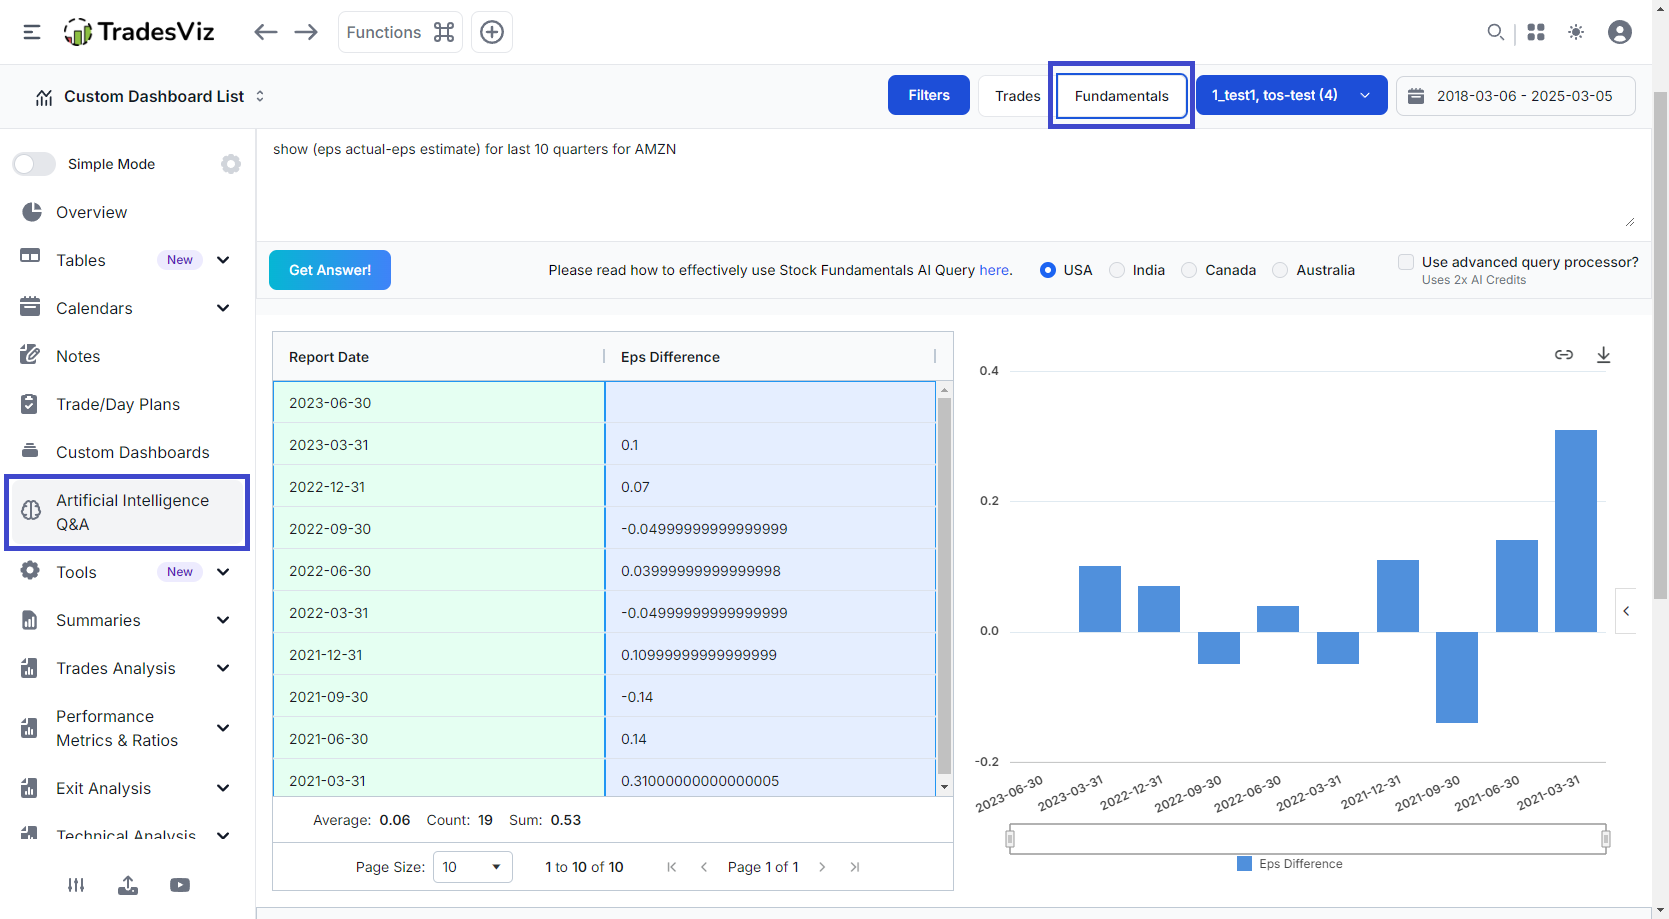
The interface is just like an AI query. The only difference is, instead of the checkbox to query the executions or trade data, you will now be able to select which country's symbols you want to ask a question about.
The above example shows a question of EPS (earnings per share) difference for Amazon (AMZN) stock. The idea is that instead of opening the fundamentals page of AMZN.US, you can ask your question here and get exactly what you want.
That's not all. This is a generic Q&A system, meaning you can indeed ask questions about the general market to look for specific stocks based on conditions or to visualize data across many symbols/groups. Here's an example:
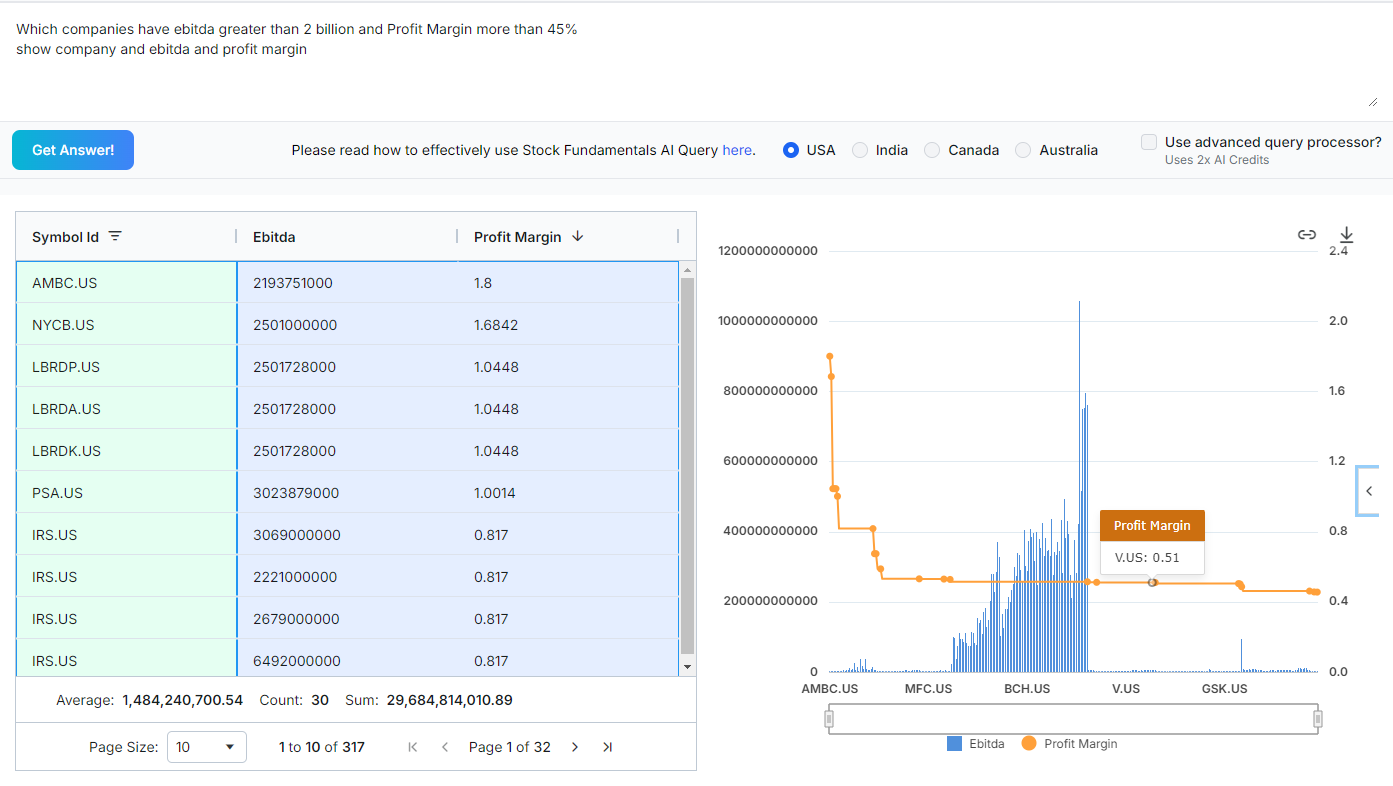
Here, we are looking for companies with specific EBITDA (earnings before interest, taxes, depreciation, and amortisation) and profit margins.
At this point, you may wonder what can be queried. Here's the complete list:
| Point-in-Time Data (updated every quarter) |
Per-Quarter Data (updated and accumulated every quarter) |
|---|---|
| Sector | Total Assets |
| Industry | Intangible Assets |
| Gic Group | Other Current Assets |
| Sub Industry | Total Liabilities |
| Full Time Employees | Total Stockholder Equity |
| Market Capitalization | Deferred Long Term Liabilities |
| Market Capitalization Mln | Other Current Liabilities |
| PE Ratio | Common Stock |
| PEG Ratio | Capital Stock |
| Wall Street Target Price | Retained Earnings |
| Book Value | Other Liabilities |
| Dividend Share | Goodwill |
| Dividend Yield | Other Assets |
| Earnings Share | Cash |
| EPS Estimate Current Year | Cash and Equivalents |
| EPS Estimate Next Year | Total Current Liabilities |
| EPS Estimate Next Quarter | Current Deferred Revenue |
| EPS Estimate Current Quarter | Net Debt |
| Most Recent Quarter | Short Term Debt |
| Profit Margin | Short Long Term Debt |
| Operating Margin TTM | Short Long Term Debt Total |
| Return On Assets TTM | Other Stockholder Equity |
| Return On Equity TTM | Property Plant and Equipment |
| Revenue TTM | Total Current Assets |
| Revenue Per Share TTM | Long Term Investments |
| Quarterly Revenue Growth YOY | Net Tangible Assets |
| Gross Profit TTM | Short Term Investments |
| Diluted EPS TTM | Net Receivables |
| Quarterly Earnings Growth YOY | Long Term Debt |
| Trailing PE | Inventory |
| Forward PE | Accounts Payable |
| Price Sales TTM | Accumulated Other Comprehensive Income |
| Price Book MRQ | Common Stock Total Equity |
| Enterprise Value | Retained Earnings Total Equity |
| Enterprise Value Revenue | Non Current Assets Other |
| Enterprise Value EBITDA | Non Current Assets Total |
| Shares Outstanding | Long Term Debt Total |
| Shares Float | Non Current Liabilities Other |
| Percent Insiders | Non Current Liabilities Total |
| Percent Institutions | Capital Surplus |
| Shares Short | Liabilities and Stockholders Equity |
| Shares Short Prior Month | Cash and Short Term Investments |
| Short Ratio | Property Plant and Equipment Gross |
| Short Percent Outstanding | Property Plant and Equipment Net |
| Short Percent Float | Accumulated Depreciation |
| Beta | Net Working Capital |
| Week 52 High | Net Invested Capital |
| Week 52 Low | Common Stock Shares Outstanding |
| Day 50 MA | Investments |
| Day 200 MA | Change to Liabilities |
| Short Percent | Total Cashflows From Investing Activities |
| Forward Annual Dividend Rate | Net Borrowings |
| Forward Annual Dividend Yield | Total Cash From Financing Activities |
| Payout Ratio | Change To Operating Activities |
| Dividend Date | Net Income |
| Ex Dividend Date | Change in Cash |
| Last Split Factor | Begin Period Cash Flow |
| Last Split Date | End Period Cash Flow |
| Rating | Total Cash From Operating Activities |
| Target Price | Depreciation |
| Strong Buy | Other Cashflows From Investing Activities |
| Buy | Dividends Paid |
| Hold | Change To Inventory |
| Sell | Change To Account Receivables |
| Strong Sell | Sale Purchase Of Stock |
| Other Cashflows From Financing Activities | |
| Change To Netincome | |
| Capital Expenditures | |
| Change Receivables | |
| Cash Flows Other Operating | |
| Cash and Cash Equivalents Changes | |
| Change in Working Capital | |
| Stock Based Compensation | |
| Other Non Cash Items | |
| Free Cash Flow | |
| Research Development | |
| Income Before Tax | |
| Selling General Administrative | |
| Gross Profit | |
| Reconciled Depreciation | |
| EBIT | |
| EBITDA | |
| Depreciation and Amortization | |
| Non Operating Income Net Other | |
| Operating Income | |
| Other Operating Expenses | |
| Interest Expense | |
| Tax Provision | |
| Interest Income | |
| Net Interest Income | |
| Income Tax Expense | |
| Total Revenue | |
| Total Operating Expenses | |
| Cost of Revenue | |
| Total Other Income Expense Net | |
| Net Income From Continuing Ops | |
| Net Income Applicable To Common Shares | |
| Shares | |
| EPS Actual | |
| EPS Estimate | |
| EPS Difference | |
| Surprise Percent | |
| Growth | |
| Earnings Estimate Avg | |
| Earnings Estimate Low | |
| Earnings Estimate High | |
| Earnings Estimate Year Ago EPS | |
| Earnings Estimate Number Of Analysts | |
| Earnings Estimate Growth | |
| Revenue Estimate Avg | |
| Revenue Estimate Low | |
| Revenue Estimate High | |
| Revenue Estimate Year Ago EPS | |
| Revenue Estimate Number Of Analysts | |
| Revenue Estimate Growth | |
| EPS Trend Current |
That's a big list! But don't worry! Here's a quick guide of all the definitions listed in an easily searchable table from EZstockscreener.com: https://www.ezstockscreener.com/fundamental-metrics/ (EZstockscreener is a technical and fundamental stock screener created by the TradesViz team).
In addition to the tables that are generated by the AI's result, the chart you see can be fully customized. Here's an example:
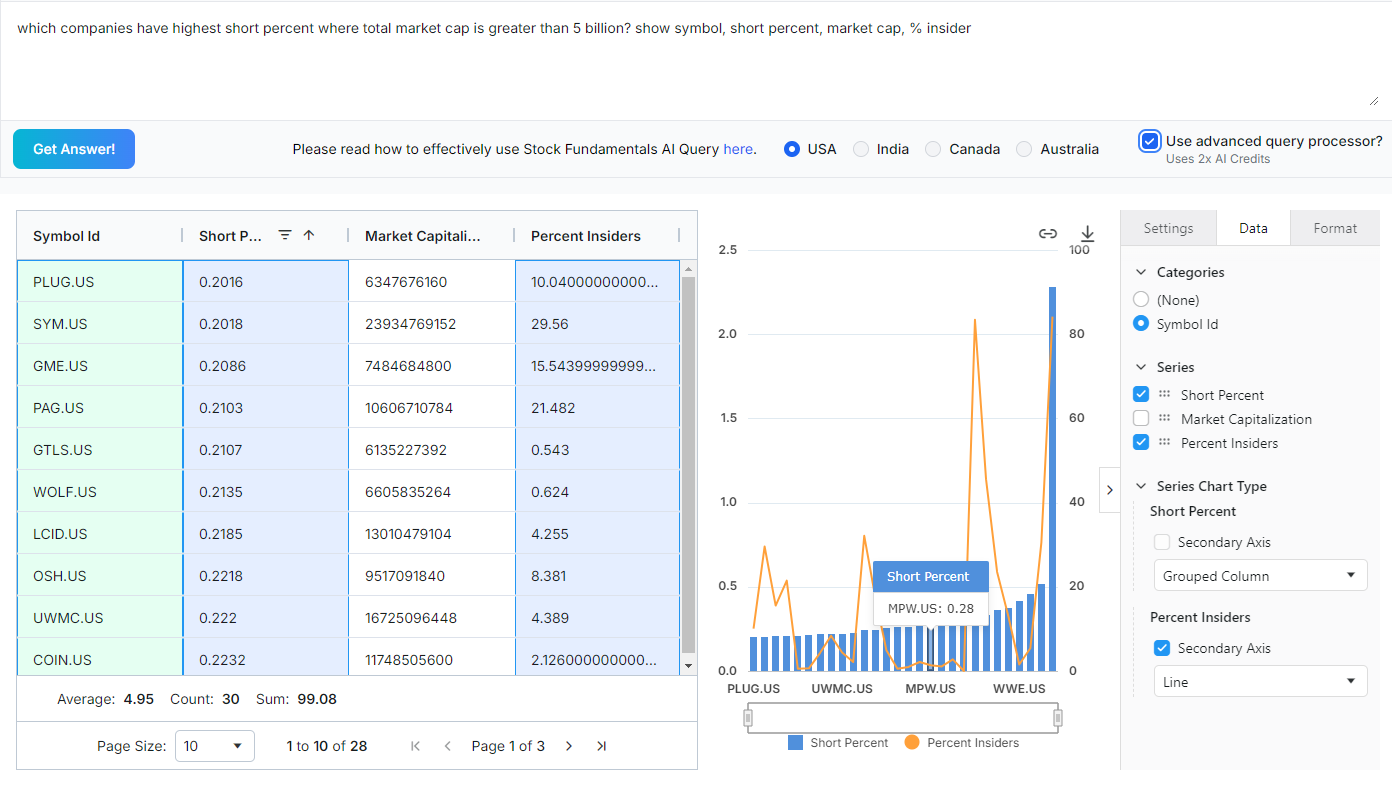
While the AI is continually improved on TradesViz's side, we suggest traders use the "Advanced query processor" checkbox whenever the normal query process isn't able to give you the results you are looking for. Remember that currently, the fundamental AI query limit is 10 for pro and 20 for Platinum *per day* - that's per unique query. All of your queries are cached, and cached queries do not count toward the daily quota. We will increase this progressively as we did for the trade AI Q&A.
At the moment, these query results cannot be added to the custom dashboard, unlike the AI Q&A result, but that might change soon :)
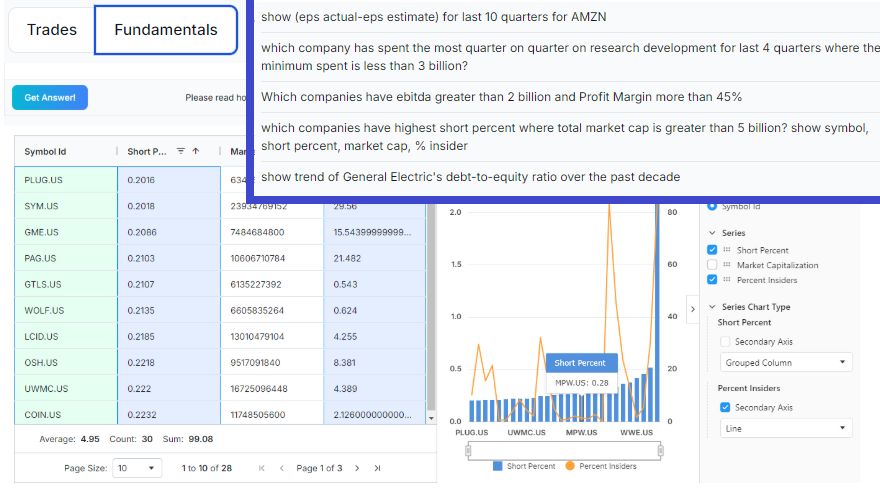
For now, here are some simple AI queries to get you started:
- show total revenue of palo alto networks from 2009 along with earnings estimate for each year
- What is the current market capitalization of AAPL in billions?
- Show top 10 companies and percent insiders with highest percent insiders in the last quarter
- Show quarter, cost of revenue from 2009 for AAPL, TSLA, F, ADBE (show each symbol in one column and fill empty rows with zero)
- show quarter (YYYY-MM), symbol, revenue growth of AAPL, MSFT, and AMZN over the last 3 years where each symbol is it's own column for each quarter (row) drop empty rows
- show (eps actual-eps estimate) for last 10 quarters for AMZN
- which company has spent the most quarter on quarter on research development for last 4 quarters where the minimum spent is less than 3 billion?
- Which companies have ebitda greater than 2 billion and Profit Margin more than 45%
- which companies have highest short percent where total market cap is greater than 5 billion? show symbol, short percent, market cap, % insider
- show trend of General Electric's debt-to-equity ratio over the past decade
The goal is to learn about companies and the general macro trends of the sectors, industries, and companies you care about. We realize this is not the first type of this feature available online, but do remember that standalone solutions that offer and do exactly this cost more than an entire TradesViz subscription. Here, it's all built into TradesViz and is part of your plan.
Start exploring and ask the right questions, and you will be able to identify opportunities in the market and be a trader that also invests/trades on a longer timeframe.
Intraday trading or swing trading and trend following aren't the only types of trading. Some of the largest traders in the world make few trades per year based on fundamentals alone and make a lot more than higher-frequency traders. All of this comes from looking at 1000s of financial statements. You can get all of that knowledge in a single click here on TradesViz with Fundamentals AI Q&A.
As you continue using the Fundamentals AI, please let us know your feedback. It's extremely valuable to us and will help us improve the AI query processor, which in turn makes the model much better in the next iteration, not only for you but for everyone.
Soon, we will be adding more AI agents to work with stock technicals, options flow, and more ;)
The future of journaling is an integrated platform where you are able to view 100% personalized insights distilled form tens of millions of data points. Any service/platform that doesn't do this will bite the dust and any trader who doesn't make use of advanced AI tech. to speed up analysis, get better insights in trading will be left behind.
We hope this serves as an additional tool to broaden your knowledge about the market and the stocks you trade!