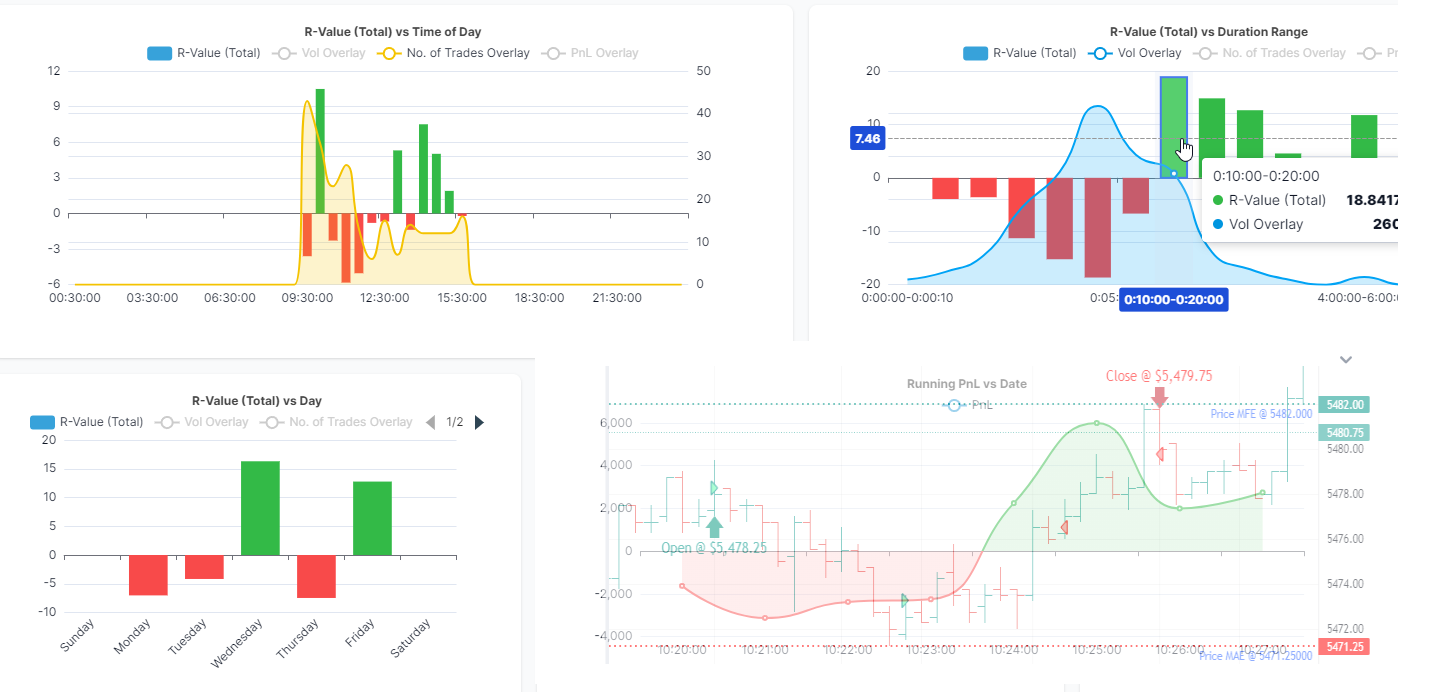
One of the main reasons traders prefer TradesViz over any other journal is due to the sheet analytics capability available here. Since we've received a lot of questions about these metrics and their usages, we wanted to create a dedicated blog post answering all common questions. First, we will begin with the common question that applies to ALL advanced metrics in general:
Several reasons:
- Your account tier may not have access to that metric. Features list: www.tradesviz.com/pricing/
- You may not have filled in the data for that metric to be calculated. Example: Filling in stop-loss is required for R-value to be generated)
- Our server may not have data yet. Example: If you made trades on the 10th and imported on the same day and see N/A for the Best exit, that's fine because we don't have intraday data yet for the 10th - it will automatically be calculated by the system before the next start of the day or late EOD same day)
If you have verified that you have access to that field, and if you have filled in the necessary data points for that field to be calculated (if required), and if you still don't see it, try recalculating the trade before contacting us.
Here is how you can re-calculate your trades:
- To recalculate any single trade, explore the trade by clicking on the target button next to the trade in the trades table and click on the "Recalculate" button above the executions table.
- To recalculate many trades at once, you can use the group apply function. In the trades table, shift/control-select the trades you want to recalculate and click on the "Group apply" button at the top of the table. Now scroll down and click on the "Re-calculate all selected trades" option and click "Save changes"
Simply drag and drop the columns in place. It's faster and more efficient to do this via the column tab that's found on the right side of almost every table in TradesViz. More info on table management can be found here. Make sure to save the state of the table so that the order/settings stay the same even when you logout and login again.
You can retain the state of the table (size, order, sorting, etc.,) by clicking on "Action" > "Save State".
Note that the same can be done for nearly ANY table on TradesViz and all the states of the tables are saved to your TradesViz profile. In some cases like the custom dashboard and in the chart explore view, you will see a 3 dots icon at the top left corner of the table instead of the actions button. Click on that to see the save state option.
Click on the "Customize" button at the top and hide/show only the stats you need. More info here.
Click on the gear icon at the top left corner (in the sidebar section) and drag and drop the columns you need. More info here.
This will greatly simplify your dashboard showing only what you need. But be careful - you may be missing out on some interesting stats if you just look at what you already know ;) It's good to explore a little bit sometimes!
Now on to specific stats, their definitions, and things you need to know before you start using them.
Running PnL Metrics
More info here: https://www.tradesviz.com/blog/running-pnl-risk-analysis/
Summary: For each trade, we calculate the highest, and lowest pnl attained during the trade (while the trade is on) few other metrics like the total time the trade was in the green (positive pnl) and in red (negative pnl). Using these stats, TradesViz shows scatter graphs that can tell you how effectively you've managed your positions.
Usage: If you are interested in risk management, this stat must be studied thoroughly.
Availability: Platinum plan
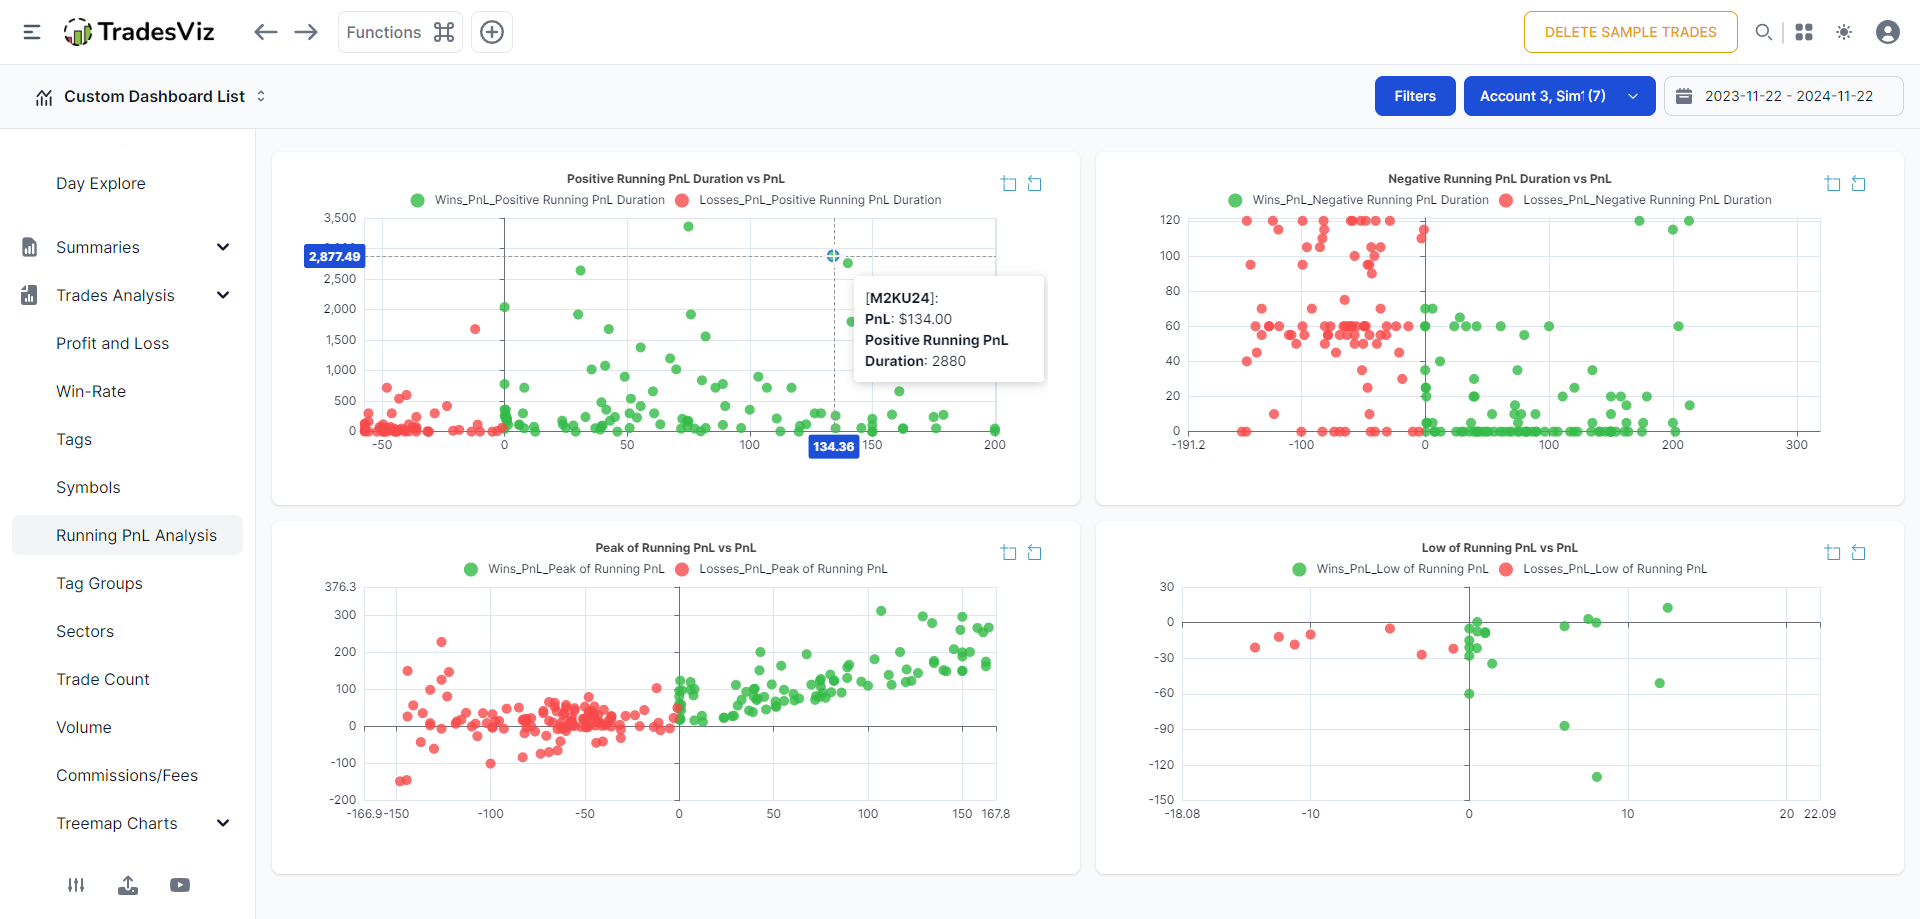
Tip: Zoom into your trends by clicking on the zoom select button at the top right corner of each chart and drag into an area of interest.
All of these charts can be added to your custom dashboard.
MFE/MAE
Maximum favorable excursion/Maximum adverse excursion
More info here: https://www.tradesviz.com/blog/mfe-mae-charts/
Summary:
Usage: If you are interested in drawdown anlaysis and max risk you are taking during a trade, or if you want to optimize your stop losses, this stat must be studied thoroughly.
Caveat [PLEASE READ]:
There are two types of MFE/MAE on TradesViz. Till November, we only had MFE/MAE calculated using the price MFE/MAE multiplied by the total position of the trade. This is the theoretical maximum loss or profit you can get from a trade. This works for all trades that have one entry and one exit or if you want to learn what's the max you could have lost/gained during the trade irrespective of scaling in and out.
To accommodate this, we introduced a setting called "Use running PnL for Trade MFE/MAE calculation?" in your account settings. This setting is checked by default for all new accounts created from Nov 2024.
Let's look at this with a more in-depth example. Here's a simple ES trade. 4 executions. Long trade.
Notice the MFE/MAE calculations! This is with the "Use running PnL for Trade MFE/MAE calculation" option UNCHECKED.
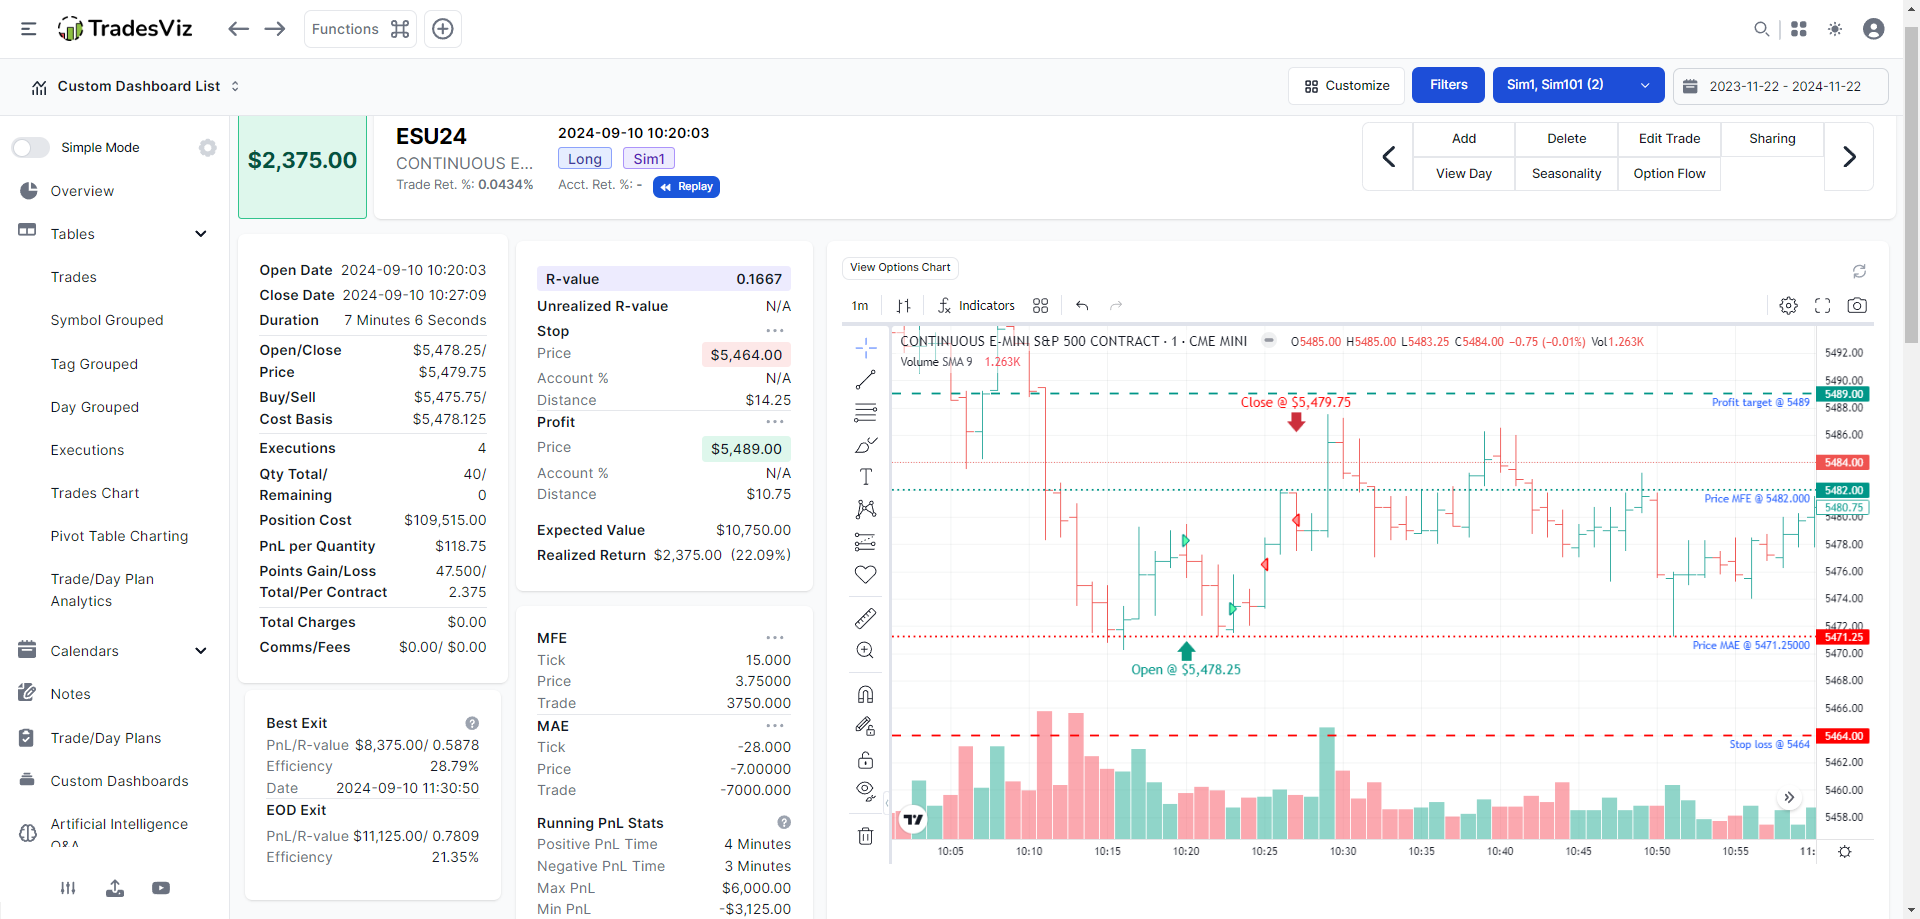
The execution table is given below in case you want to replicate this on your own.

| Price | Trade | Tick | |
| MFE | 3.75 | $3750 | 15 |
| MAE | -7 | -$7000 | -28 |
Open price: $5,478.25
First, we will always start with price MFE/MAE. Price MAE/MFE is calculated as the difference between the open execution's price and the highest price point during the trade for MFE (favorable) and the difference between the pen execution's price and the lowest price point during the trade for MAE (adverse/worse).
Therefore,
Price MFE = 5482 - 5478.25 = 3.75
Price MAE = 5471.25 - 5478.25 = -7
In other words, the price went up to 3.75 points in our favor (in this long position) and 7 points against our favor/position.
Theoretical Trade MFE/MAE: We define this as the MAX possible amount you can lose or gain in this trade given your entire position size and the price MFE/MAE.
Using the above definition,
(Theoretical) Trade MFE = Price MFE * Total quantity opened (or all buys or all sell) = 3.75 * 20 = 75 points = $3750
(Theoretical) Trade MAE = Price MFE * Total quantity opened (or all buys or all sell) = -7 * 20 = -140 points = -$7000
These are the numbers you saw the the table and the screenshot above.
Seems unrealistic?
Remember, it's taking into account your ENTIRE position size, that's why we're calling it theoretical. It's a very stringent way to evaluate your risk.
If you are trading on prop firms/using funded accounts, you are probably looking for MFE/MAE based on running pnl. Let's explore.
For this, we will keep the "Use running PnL for Trade MFE/MAE calculation" option CHECKED (this is the default for all new users as of writing this blog post). The same trade, after checking the above option and recalculating looks like the below.
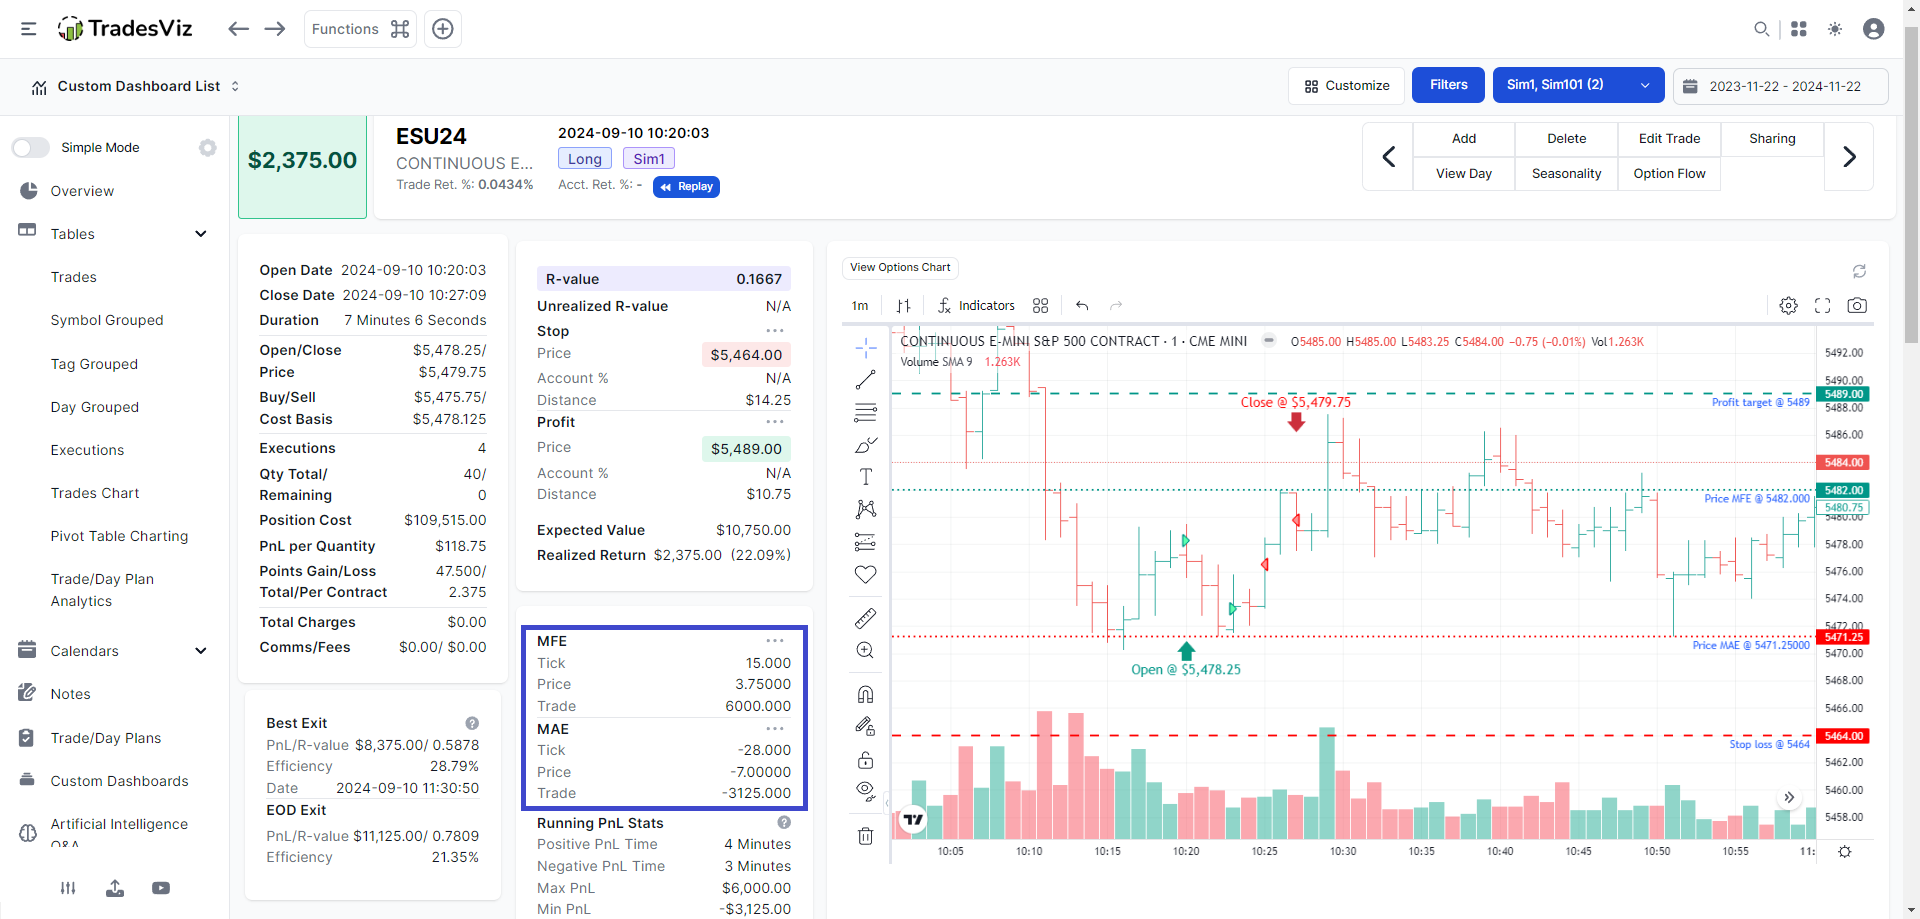
Just as the name of the option implies, the running pnl's max and min pnl are used exactly for MFE/MAE.
Ok, now how is this calculated? We take the running pnl snapshot every 5 seconds/1 minute of the trade (depending on trade duration) and get the peak (highest point) and trough (lowest point) of this graph. Ok... where is this graph? Scroll down on your trade explore page!
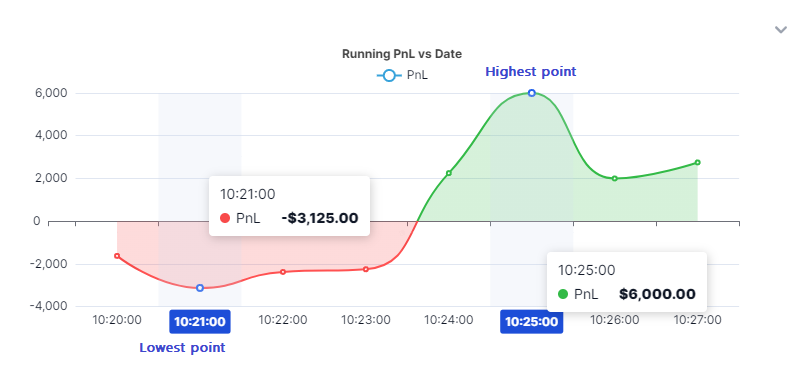
See the running pnl vs date chart? Notice the peaks and troughs!
Peak - highest pnl during the trade: $6000 - This becomes the trade MFE.
Trough - lowest pnl during the trade: -$3125 - This becomes the trade MAE.
This is a graph of what your pnl would have been exactly at each minute you were in the trade. To give you an even better visualization, here's the chart overlayed with the running pnl graph (approx):
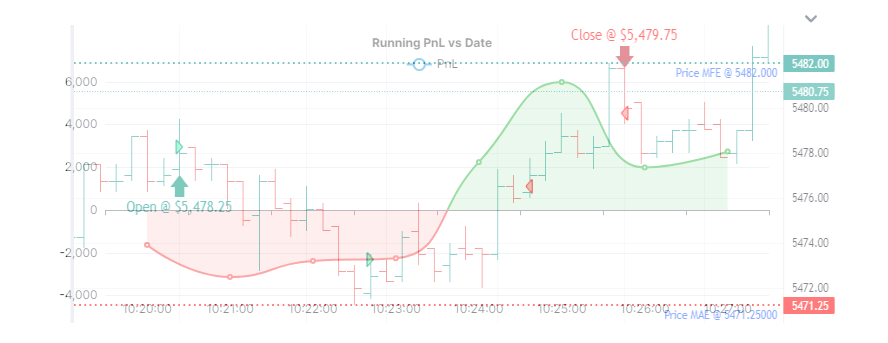
This stat gives you the max **drawdown** and the highest pnl during the trade. If you are being evaluated for prop/funded accounts, this is likely what the prop firm platforms are looking at to evaluate your performance and risk management skills.
Example: If your running pnl MAE is $1000 and if you made a total pnl of $100, that's probably not a good trade.
Now, based on your knowledge and experience, in this trade, the max running drawdown or running MAE was -$3125 and the total profit made was $2375. Is this a good trade? How would you rate this trade? Think about it.
Depending on what type of MFE/MAE you use, the charts are shown accordingly.
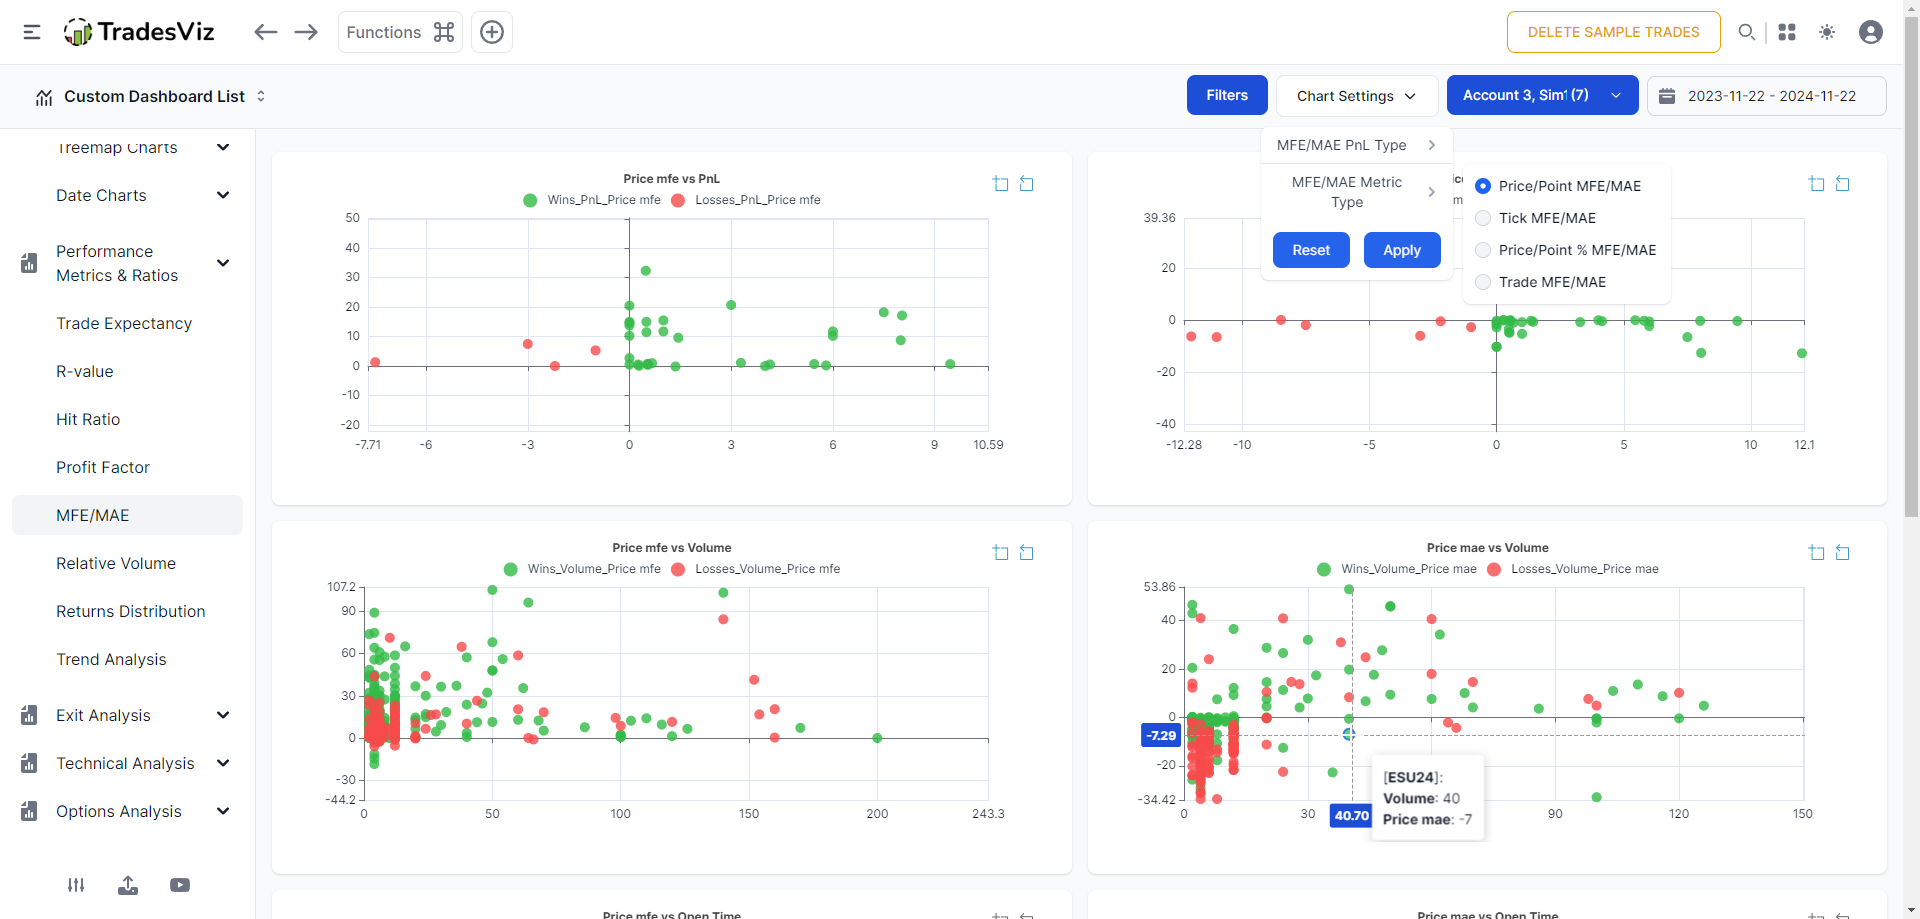
Tip: Zoom into your trends by clicking on the zoom select button at the top right corner of each chart and drag into an area of interest.
Availability: Pro and Platinum plan
All of these charts can be added to your custom dashboard.
July 2025 Update: So far, we have been using the minimum of running pnl as MAE and the maximum of running pnl as MFE. Based on our anlaysis, this gives you the maximum amount of useful info about a trade. For example, if you were in a long trade and the prices never went below the entry price, MAE for this trade would still be a non-zero, but positive number - i.e, it's the *worst* pnl you would have gotten - this NEED NOT BE negative. However, some traders are used to the definition of simply zeroing out the MAE in this case. For this purpose, we have introduced a new setting "Use alt. calculation for MFE/MAE values in cases where prices never go against entry direction?" - This is in your account settings page, and it will do exactly as mentioned in the description. If prices never go against your position, MAE will be zero. In our opinion, this is throwing away valuable data. Why? because there are many trades where you will see prices go up from your entry and come very close to your entry position only to bounce back up again - these could have very well been losses, but in the zero- MFE/MAE mode, you will lose this insight.
Best Exit Metrics
More info here:
- Exit analysis: https://www.tradesviz.com/blog/exit-analysis-charts/
- EOD exit anlaysis: https://www.tradesviz.com/blog/eod-exit-analysis-charts/
- Multi-timeframe exit anlaysis: https://www.tradesviz.com/blog/multi-timeframe-exit-analysis/ and https://www.tradesviz.com/blog/multi-timeframe-exit-pnl/
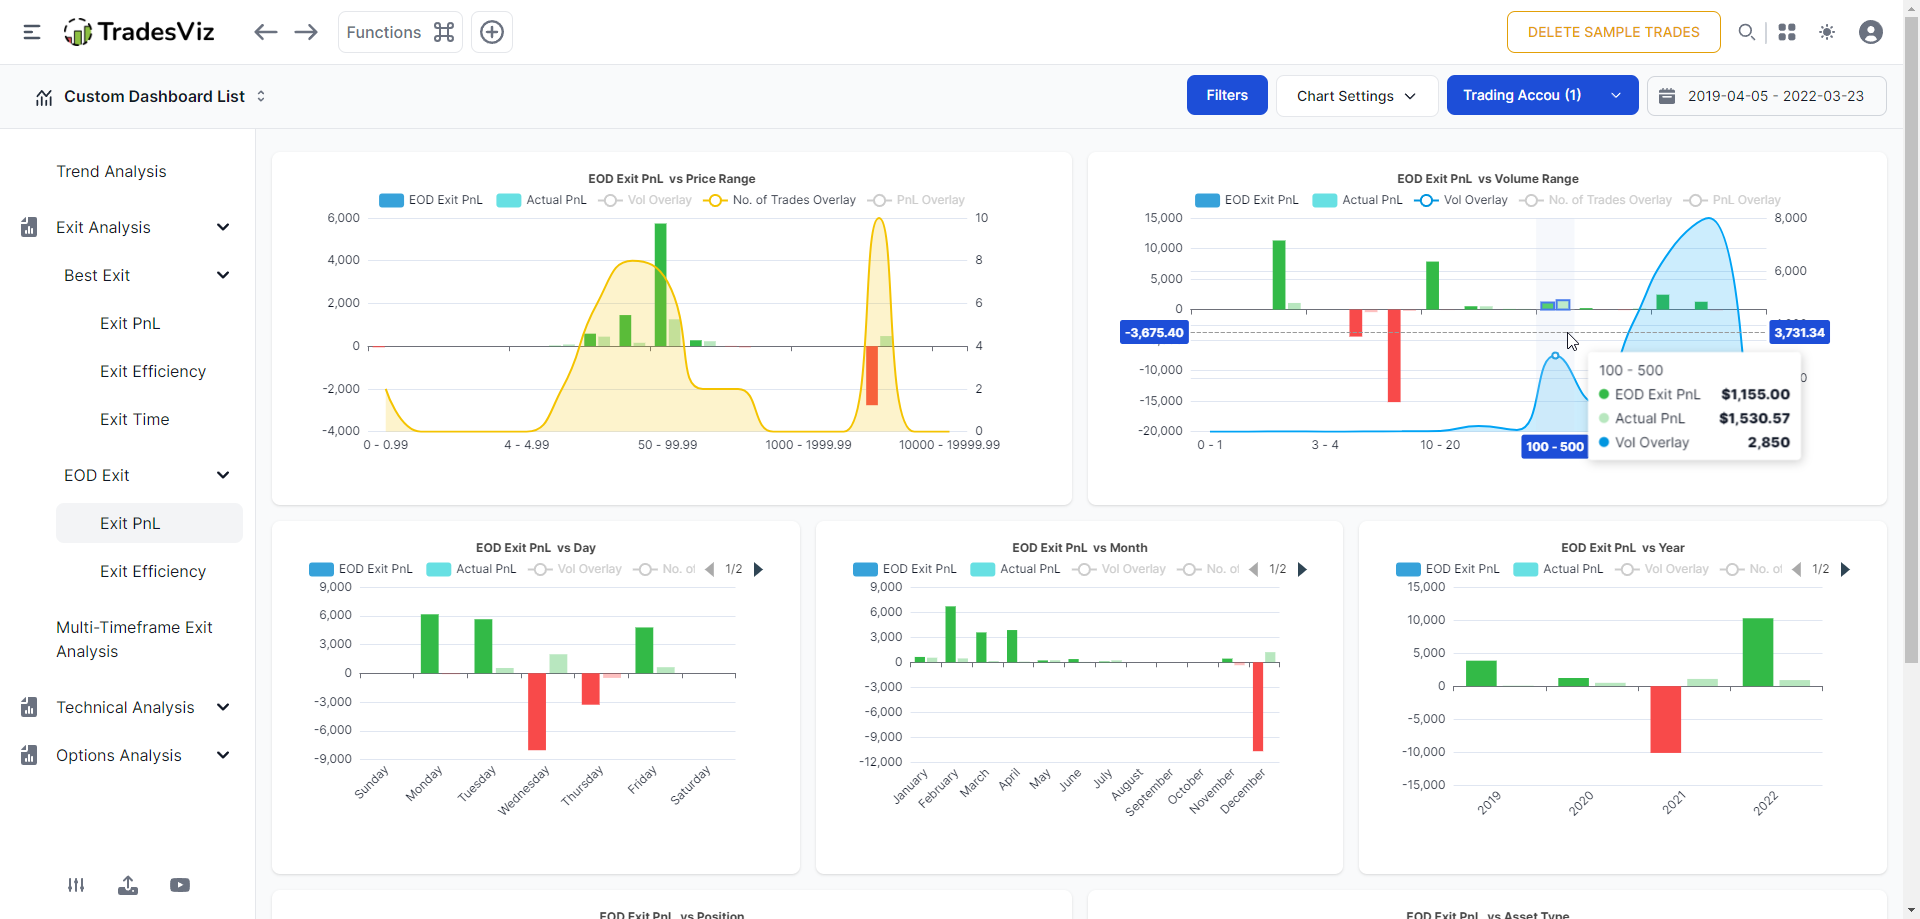
Summary: The real, proven way to analyze IF you cut your profits too soon. The saying "let your winners run" and "cut your losers" assumes traders have either foresight or a crystal ball. Since neither of these exists, we can only rely on data and past experience. This is what Best Exit aims to solve.
It's a simple simulation of: what if you **moved** the last execution around a little bit further in time? Would you have earned more? would you have lost?
What if you exited at the end of the day?
What if you exited precisely 5 minutes from entry? 2 hrs? 3 days?
All of this analysis is provided by best exit charts.
Usage: Optimize your trade exits and know when you should exit early and when you can let your trades run a little longer.
Availability: Platinum plan
Relative Volume
More info here: https://www.tradesviz.com/blog/relative-volume-analysis/
Summary: Not all trading days are created equal. ATR, volatility, avg. volume etc., many factors can influence your profitability. Knowing when to strike is key to long-term success. While most of the stats in TradesViz are based on your trading patterns, this one correlates the market's relative volume (the volume at the time of your trade) to your trading performance.
Meaning, what is your average performance when market activity is high? do you perform well in certain volume ranges? This can not only help you narrow down your trading in terms of time but also in terms of scope - symbols you trade.
Usage: Optimizing when to execute a trade and what types of stocks to pick on what days to optimize performance.
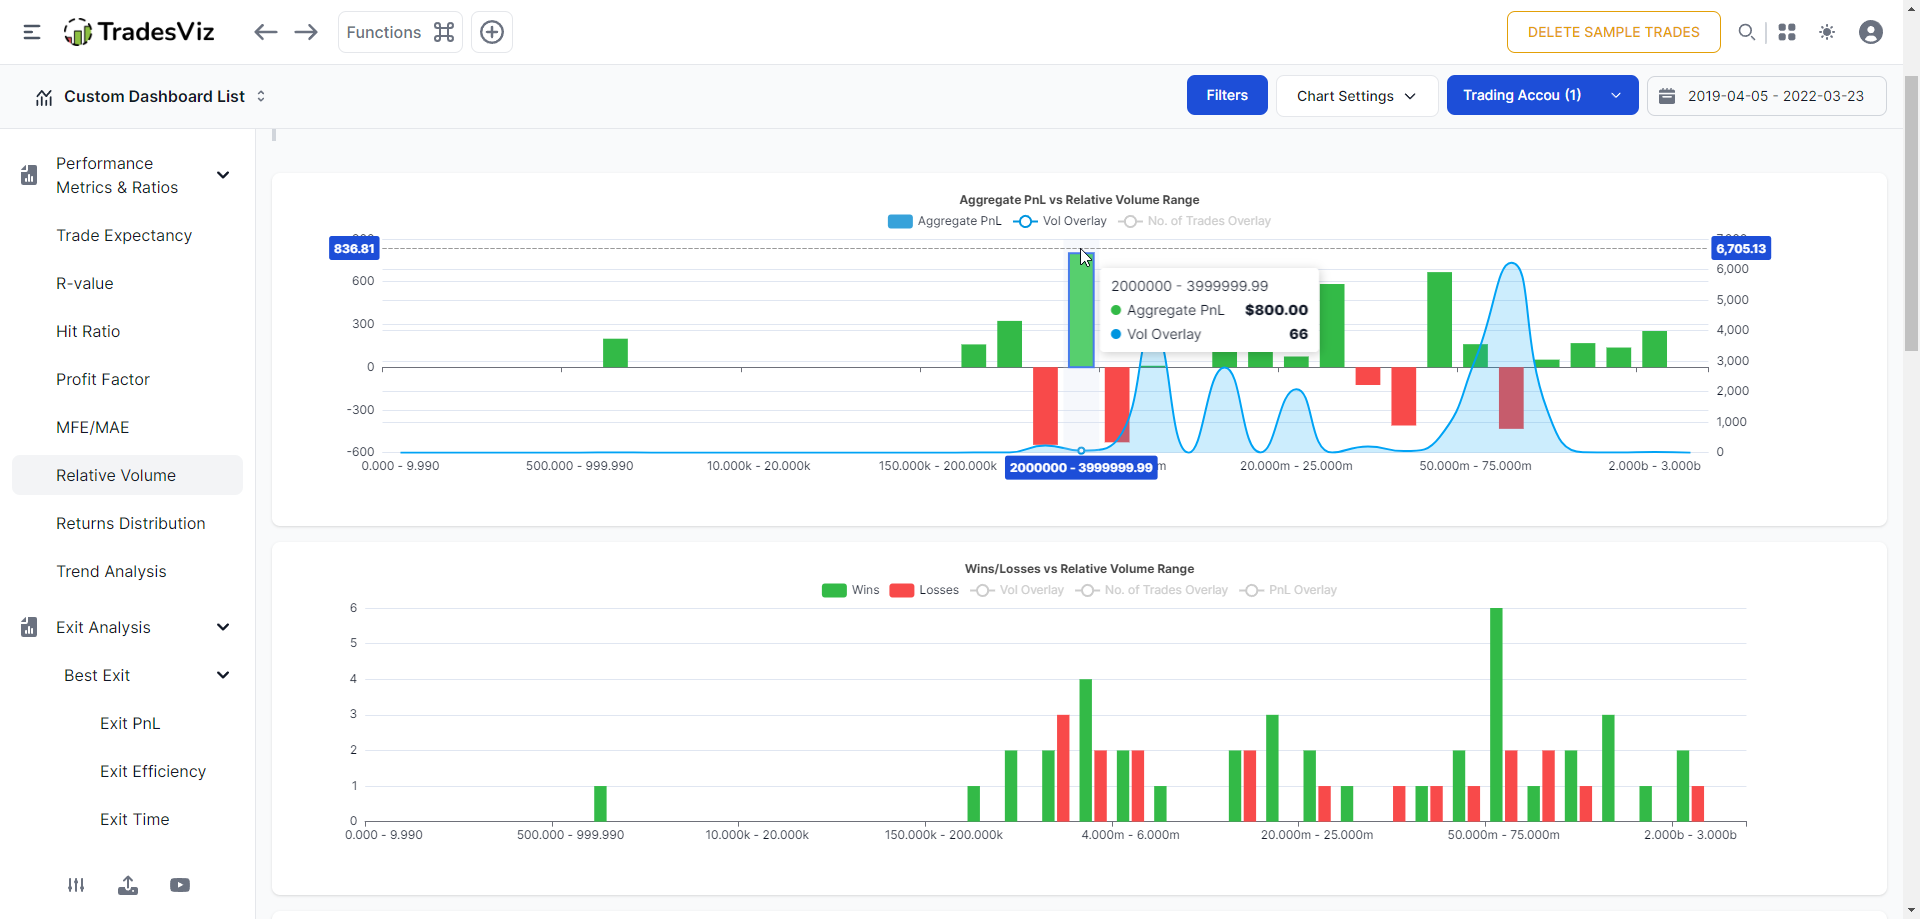
Other info: Unlike the other charts where you see price or volume range vs metrics, here you will see pnl, win/loss, reward/risk, R-value, profit factor, expectancy, and hit ratio vs relative volume range. All charts have overlays of total pnl, no. of trades, and volume to help you further correlate with more data points.
Availability: Platinum plan
All of these charts can be added to your custom dashboard.
Other simpler metrics
These metrics are available under the "Performance metrics and ratios" tab in your dashboard. They are simple but essential derivatives of basic trade stats. Again, all charts are available with overlays and can be added to your custom dashboards and all of these features are available in Pro and Platinum plans.
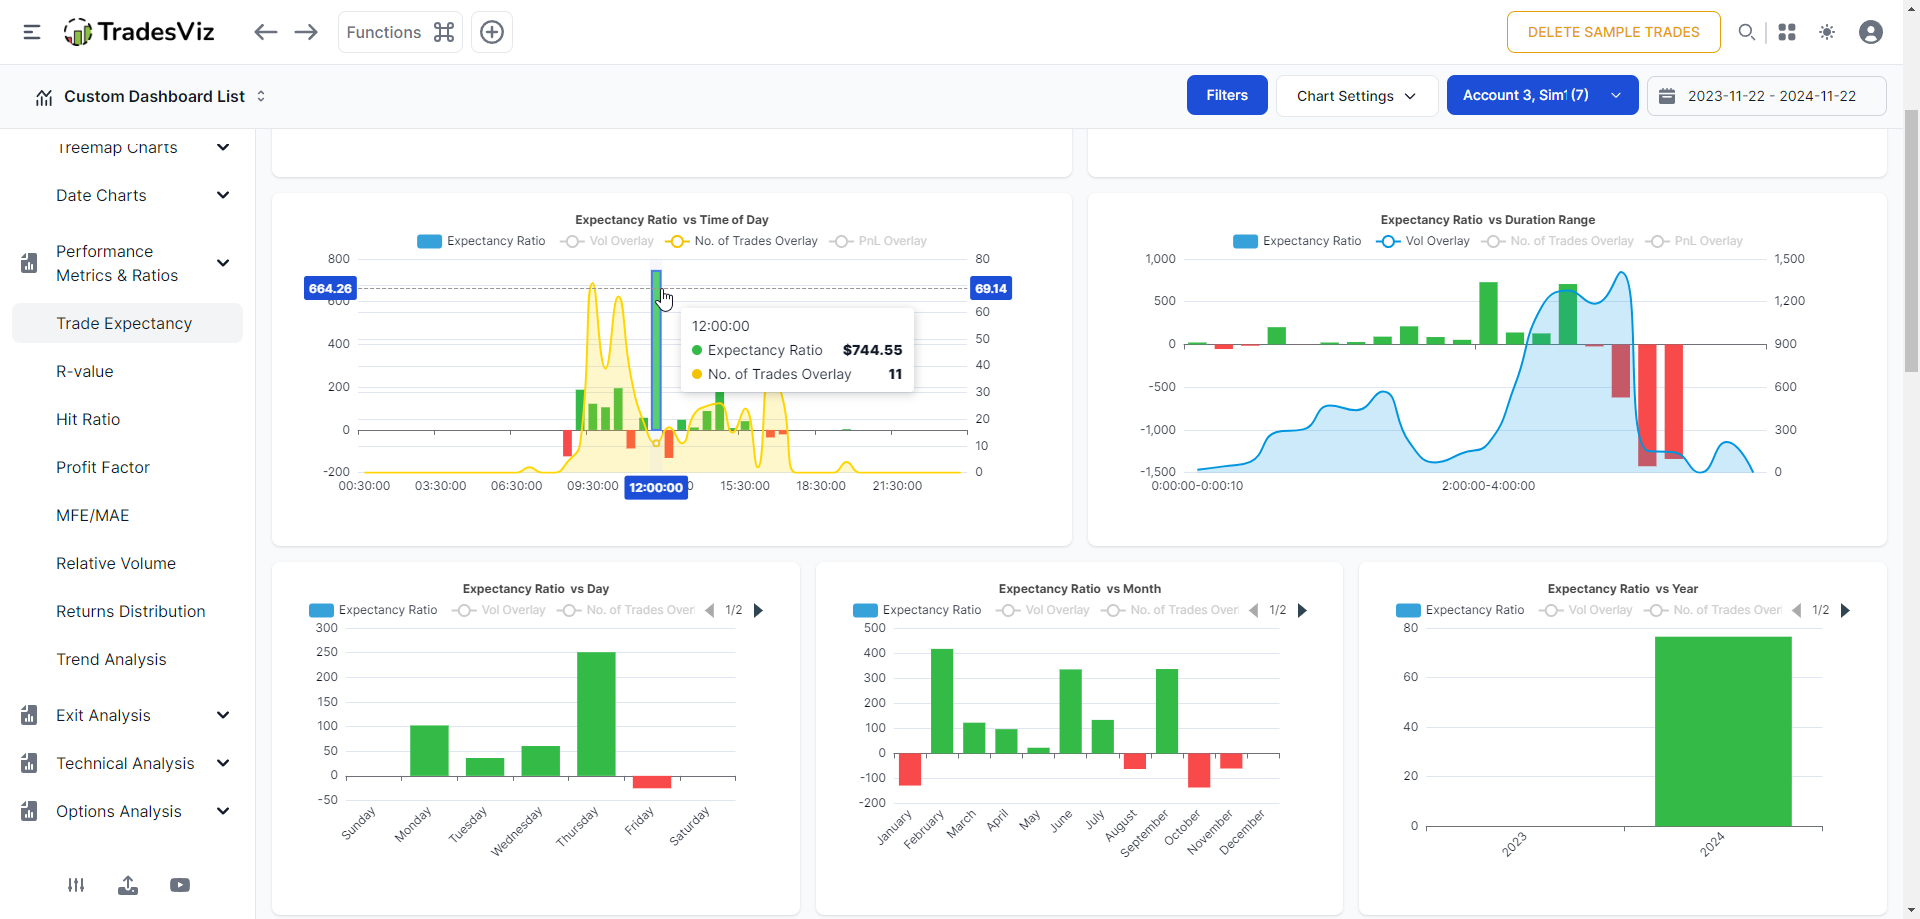
Trade expectancy
Definition: (Average winning amount x Win ratio) - (Average losing amount x Loss ratio)
Input required: None
R-value
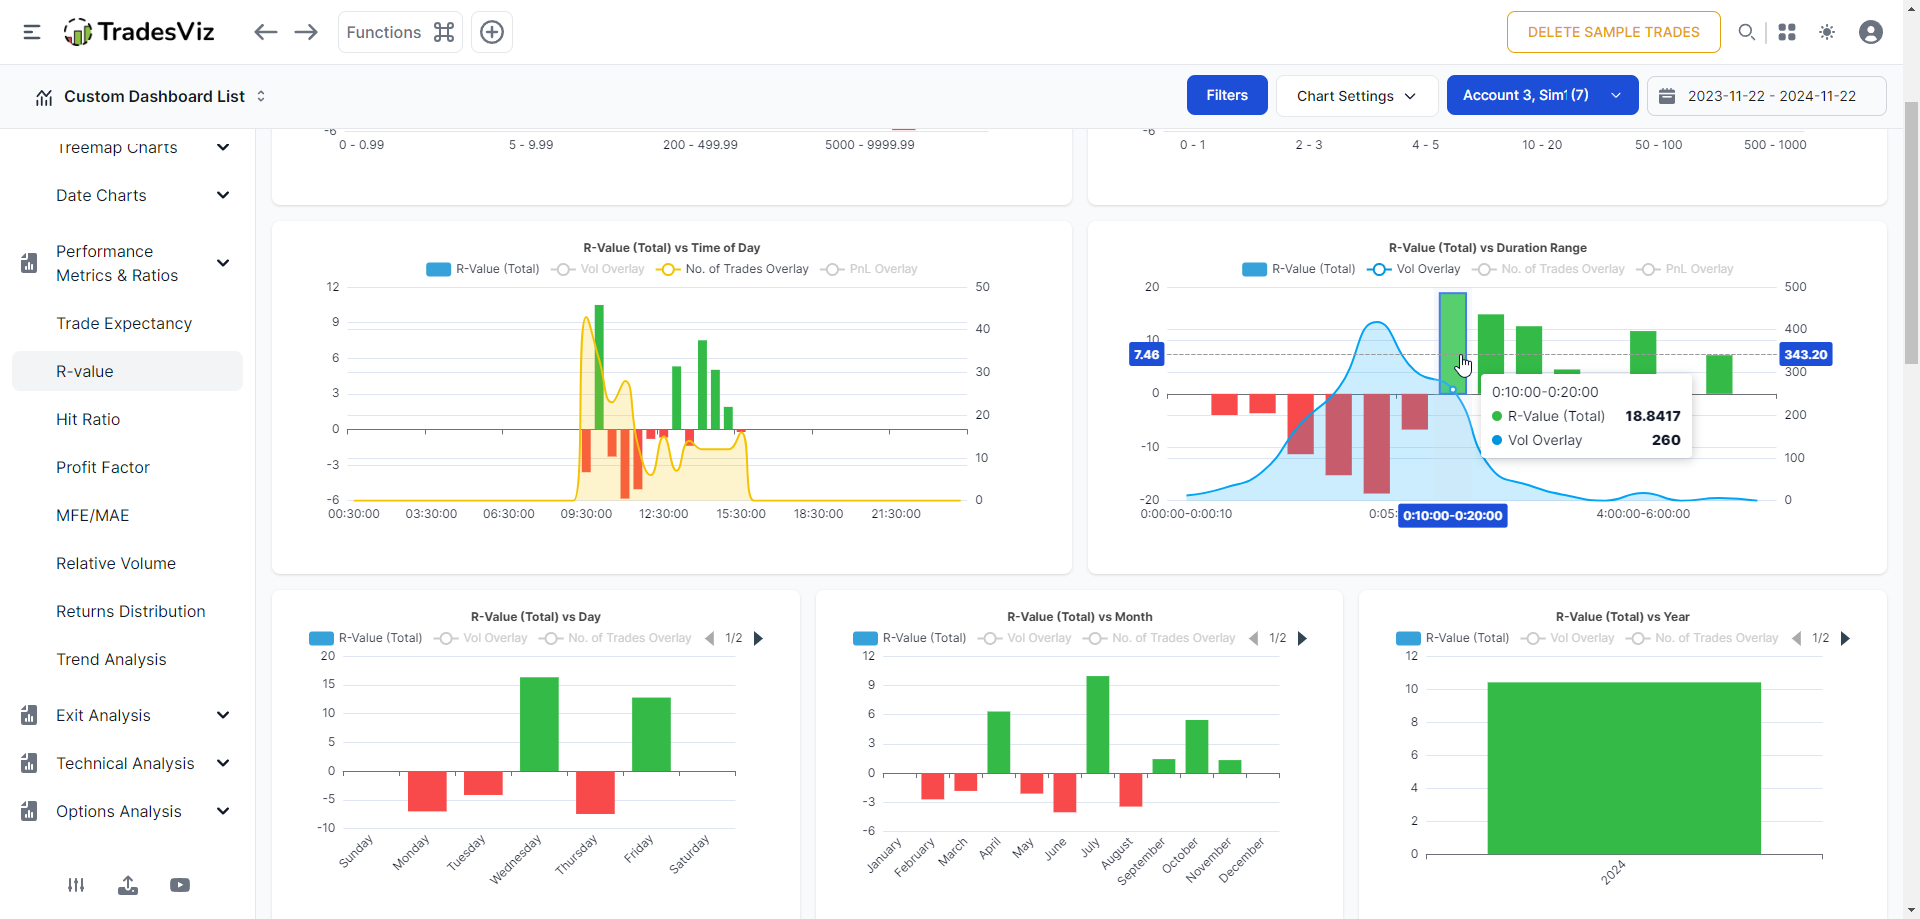
Definition for a single trade: Total PnL/Total risk taken (based on stop loss).
Input required: Stop loss
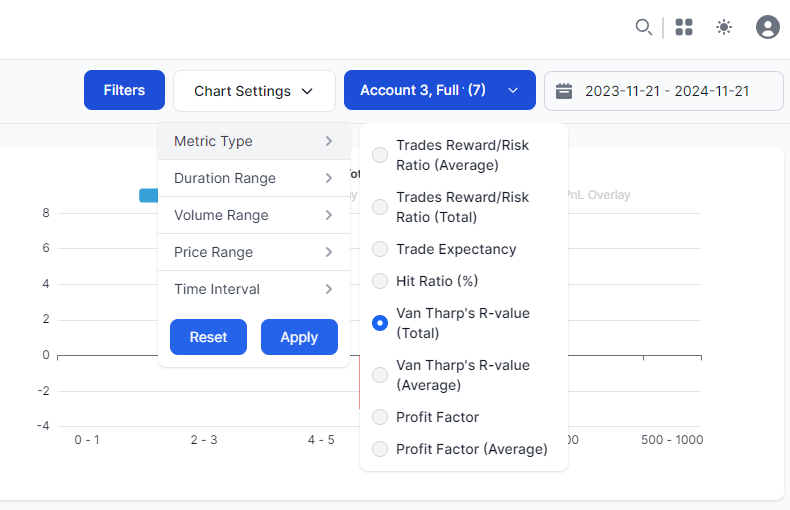
Other info: Make sure to click on "Chart setting" at the top right corner to explore additional variants!
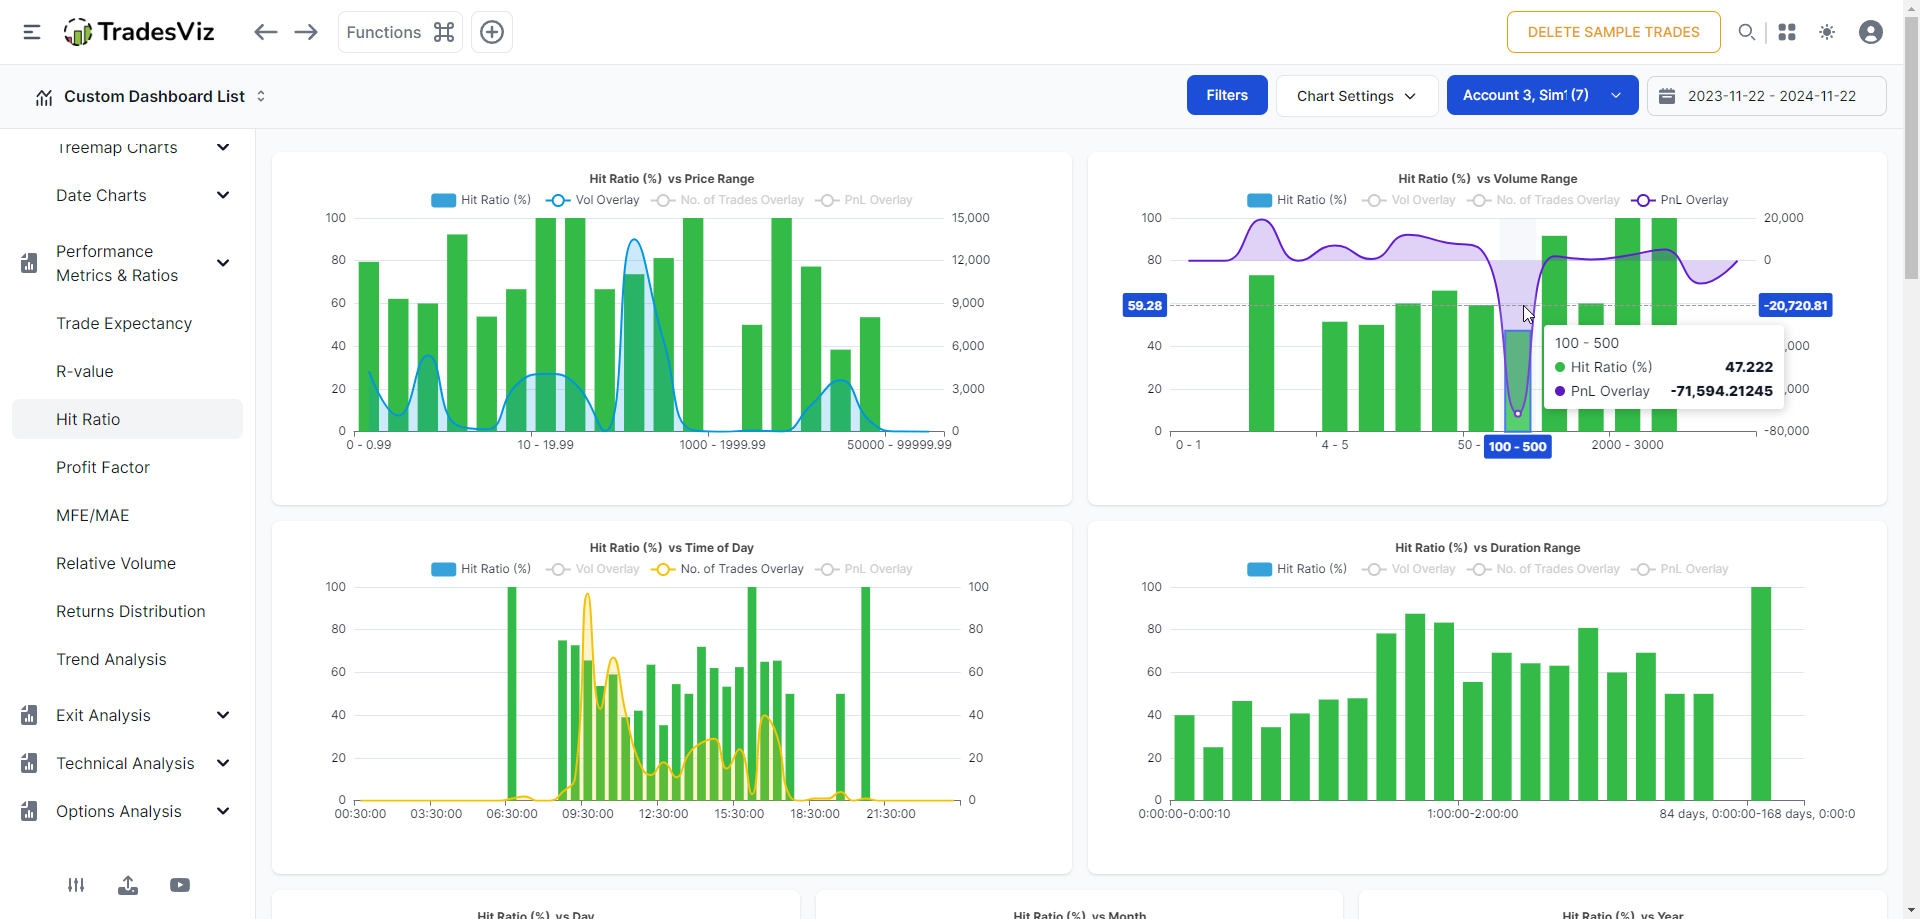
Hit-ratio
Definition: (No. of wins)/(No. of wins + No. of losses)
Input required: None
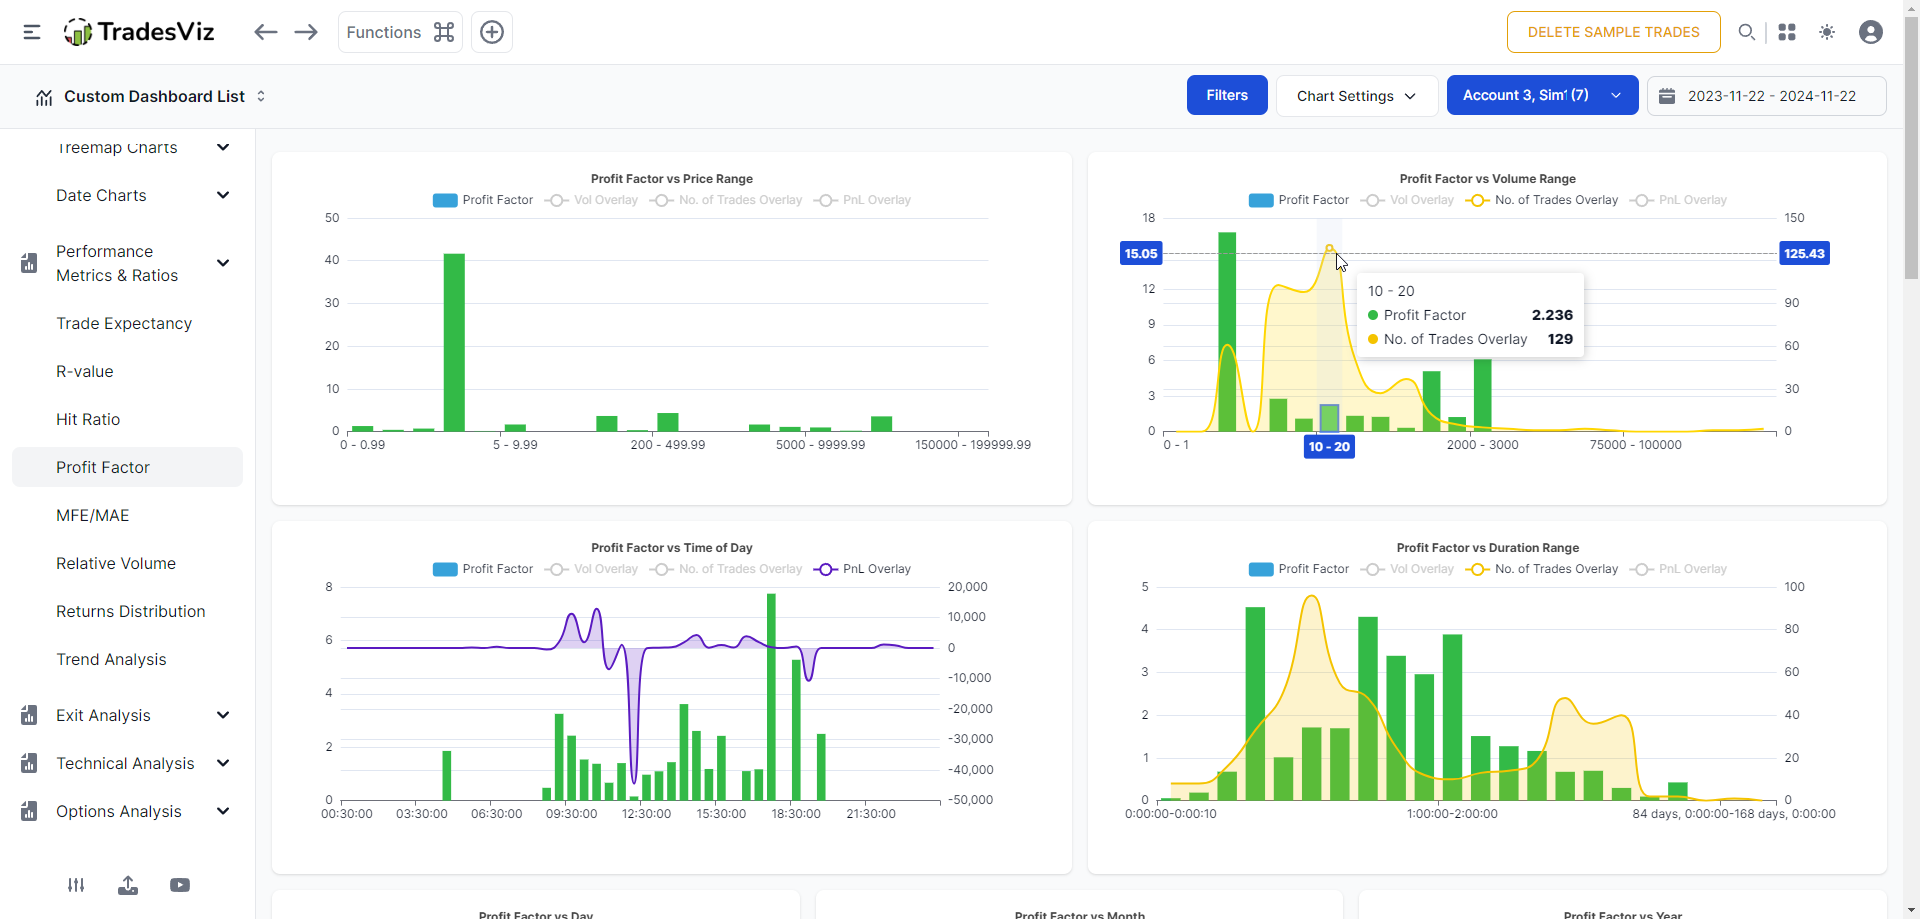
Profit Factor
Definition: Total profit/absolute value of total loss
Input required: None
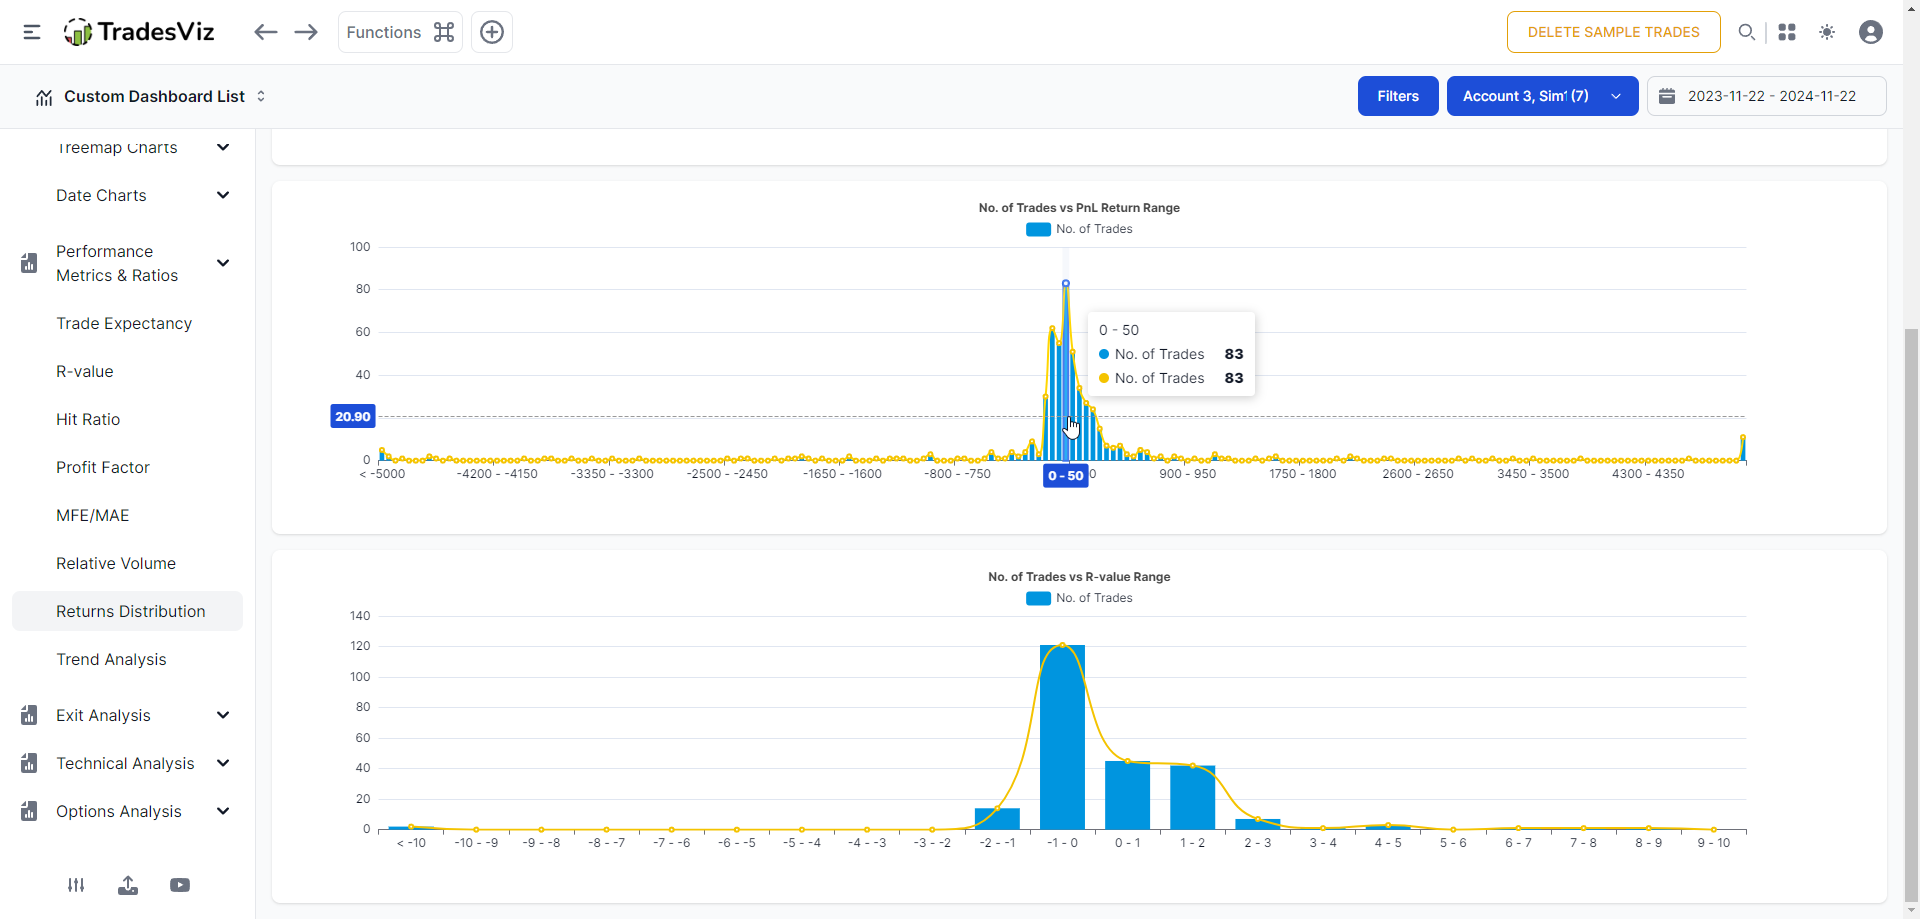
Returns Distribution
Definition: Not a stat, but a visualization of the distribution of your returns. More info here.
Input required: None for return %. Stop loss for R-value distribution (because stop loss is required to generate R-value and R-values are used for R-value distribution chart)
We hope this guide helps you tie together all the advanced stats, answer all of your questions, and help you analyze your trades better on TradesViz. Remember that none of this is complex - it's far from it. These are basic stats any trader should show in this day and age. Don't shy away from learning the stats one by one and testing them using the trading simulators we offer to understand them better.
We hope TadesViz becomes the gold standard for accurate, proven trade performance benchmarking for traders of all experience levels. In our road, we have plans to introduce more features that you can interact with and learn through the AI systems we already have in place in TradesViz. Be a more informed trader - understanding your trading and metrics is MORE than half the game here.
