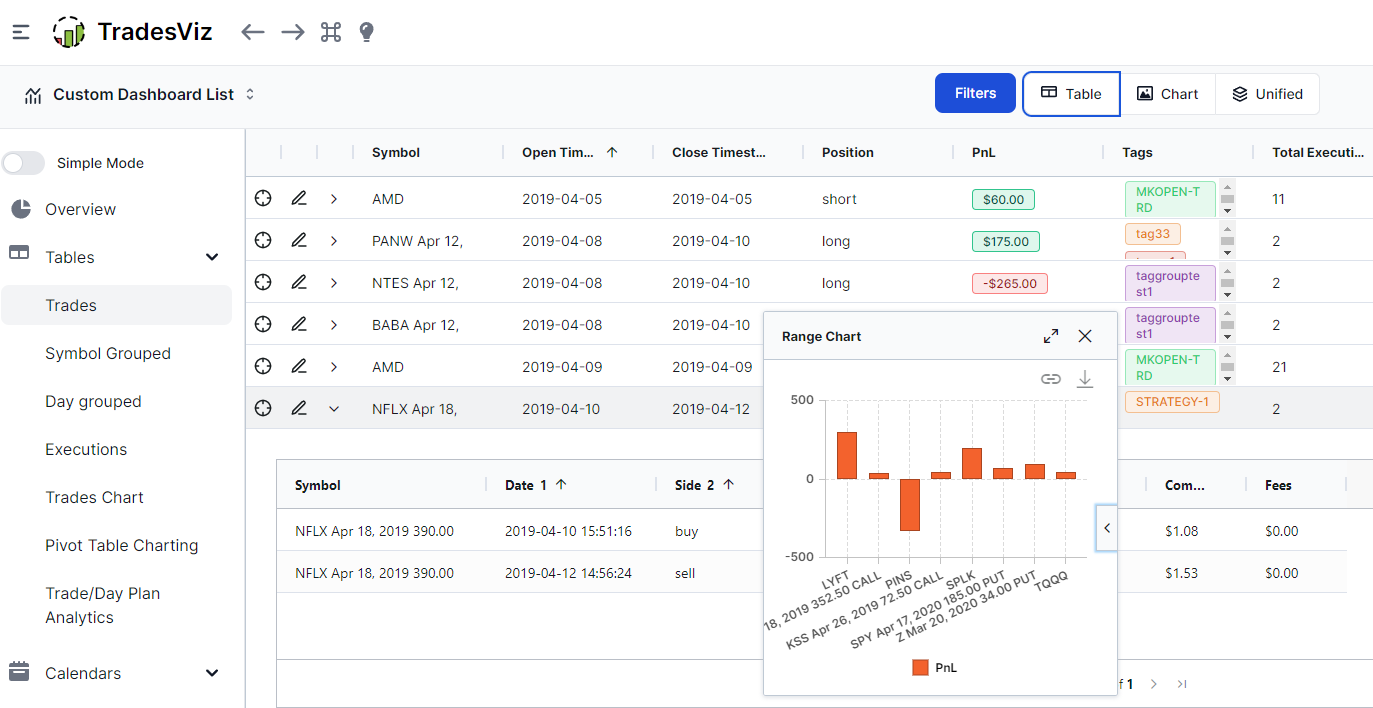
TradesViz Tables & Grids: Complete guide (Features, Customization and more)
With the introduction of TradesViz v2.0, we have completely changed all the tables of the main dashboard to be based on advanced and flexible grids. Read on to learn more about the new features and just how much better this is compared to any other tabular journaling solutions out there.
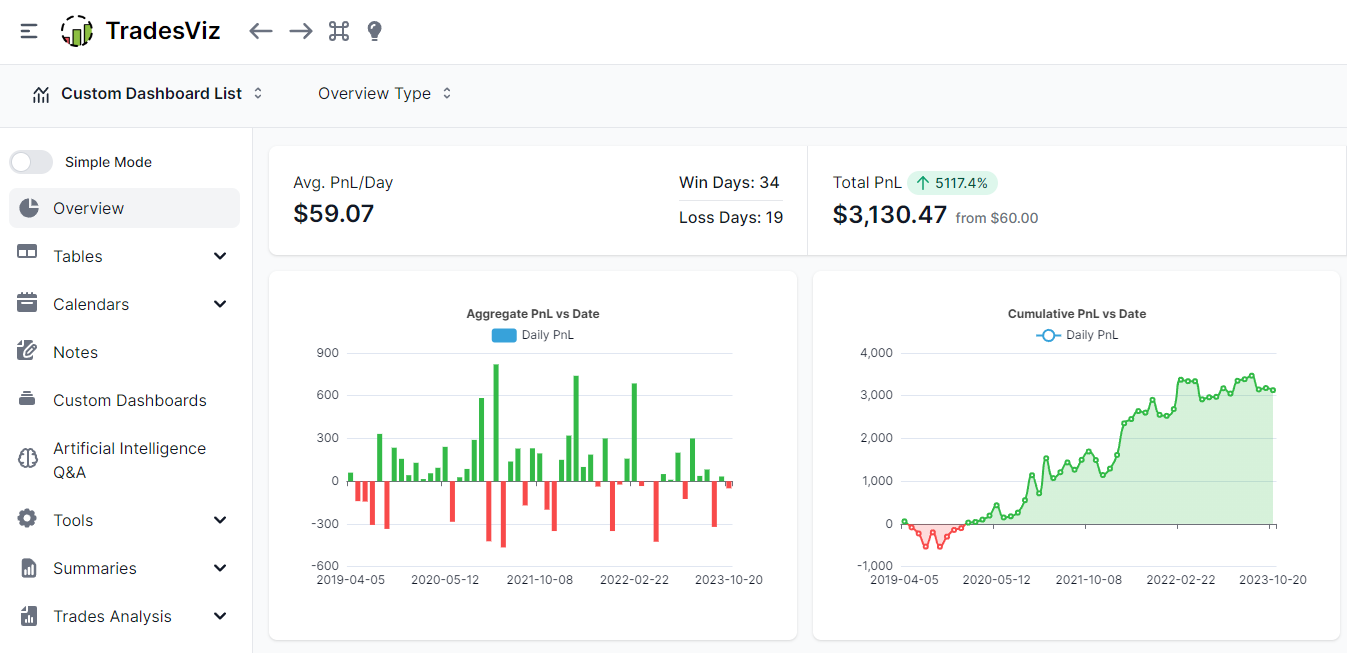
TradesViz v2.0: The next generation of TradesViz & Trade journaling (Complete Dashboard Revamp)
Introducing TradesViz v2.0. The entire dashboard is completely redesigned with state-of-the-art charts and tables to make journaling smooth and seamless for users of all experience levels and on all devices!
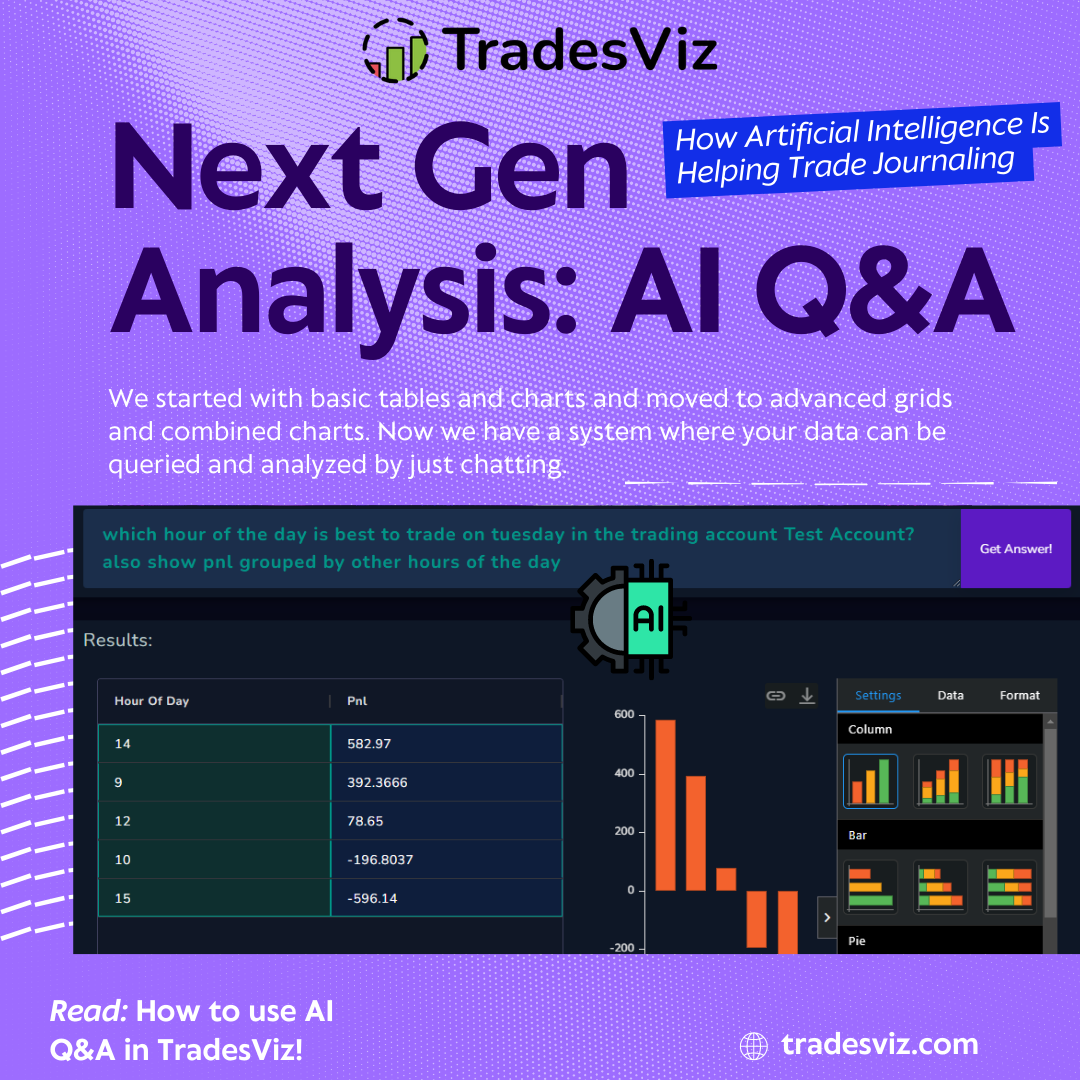
Artificial Intelligence Powered Trade Journaling: Queries list and cheatsheet guide
Are you ready to find answers to all your burning trading questions? Have you wished there was a way to visualize a particular stat? The TradesViz's AI query will solve a lot of your trading problems! Read this guide to get a list of queries you can use every day to find deeper insights!
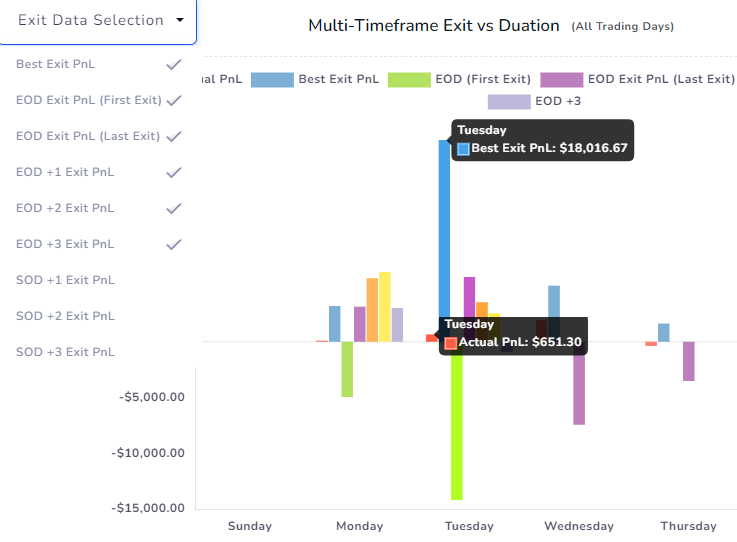
Multi-timeframe Exit Analysis: Compare all your exit simulations in one chart
The unification of all the different types of exit simulations! You can now view all your exit stats in a single chart to optimize your trade holding time to maximize your profits!
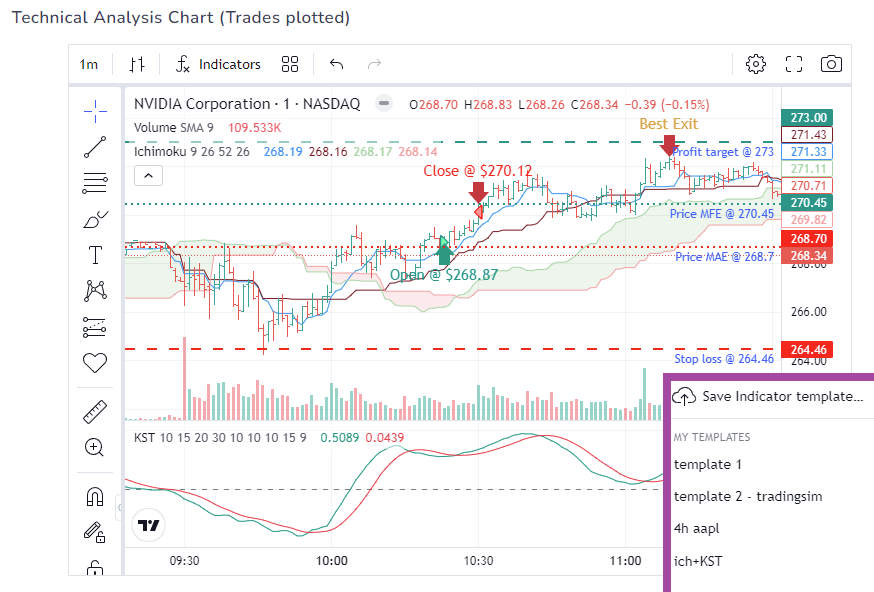
New feature: Global TradingView study/indicator templates
We've had super customizable image charts, then we introduced TradingView charts with customizable indicators and now you are able to automatically apply entire chart templates to your TradingView charts in TradesViz.