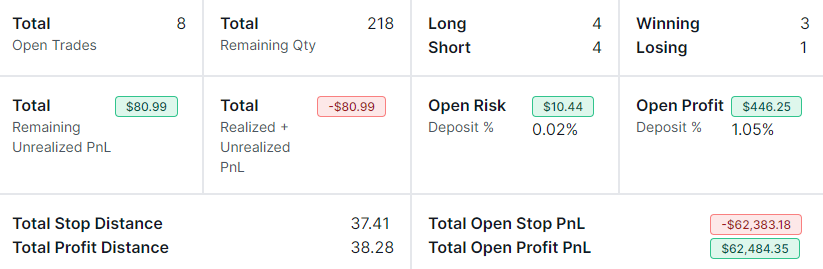
New Tab: Open trades summary
A tab dedicated to viewing only open trades/positions and a summary of them!
Guides, changelogs, deep dives and everything trade journaling.
A tab dedicated to viewing only open trades/positions and a summary of them!
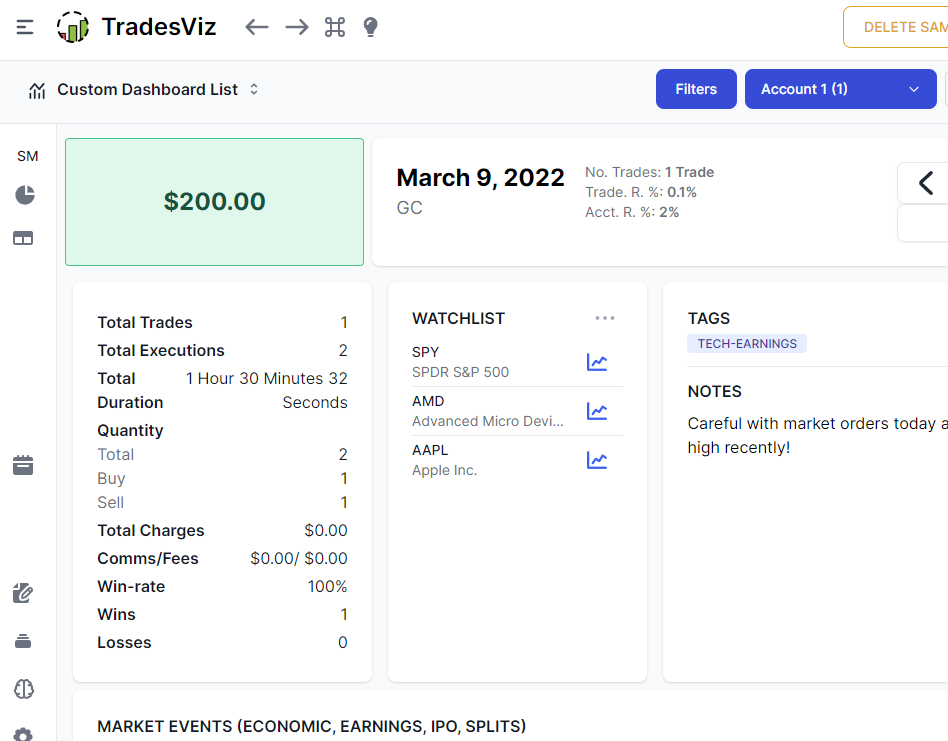
Day explore is a feature unique to TradesViz. It gives you the freedom to plan your trades, view economic events, and earnings, see all the trades you made on any particular day, add charts, and more! After tens of thousands of traders exploring their trading days, we have plenty of feedback and have put it all into the v2 version of the TradesViz Day Explore.
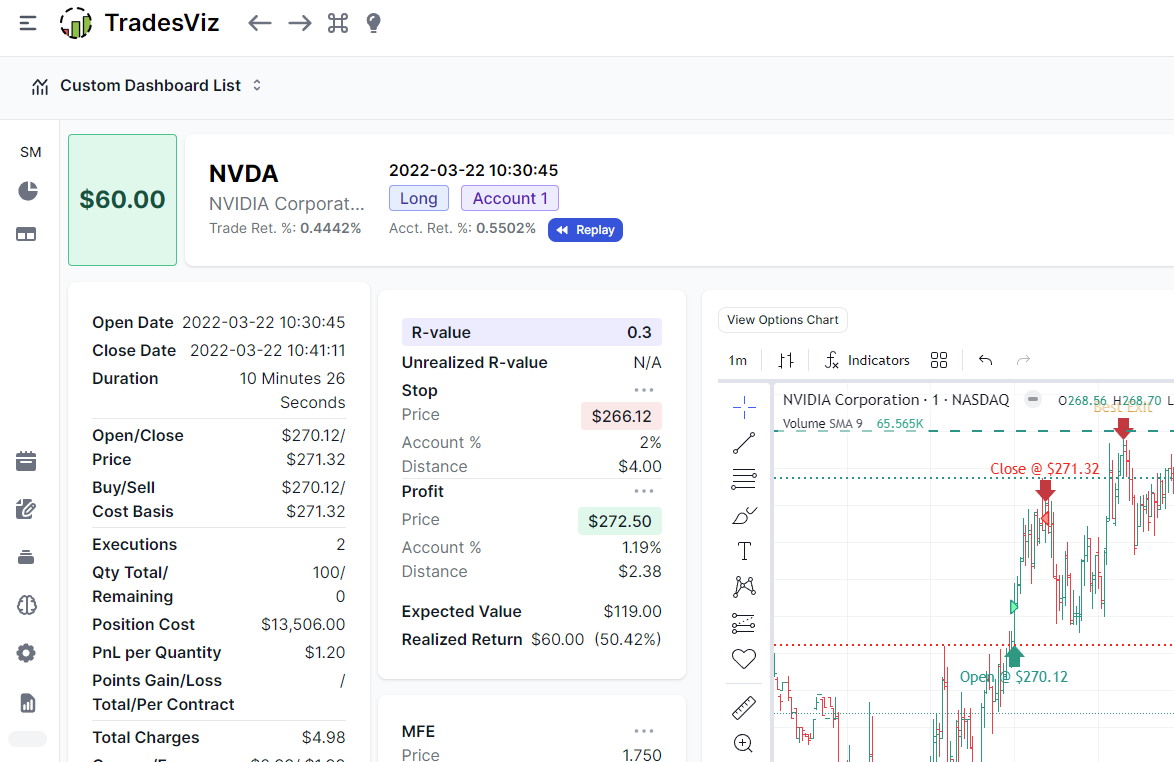
The first time we introduced the TradesViz trade explore tab was in 2020. There have been huge improvements in this whilst still preserving the originality and efficiency of viewing details about your trades. After millions of visits by tens of thousands of traders and many feedback and improvement suggestions, this blog will explore the current state of the most detailed trade information view available in any online trading journal.
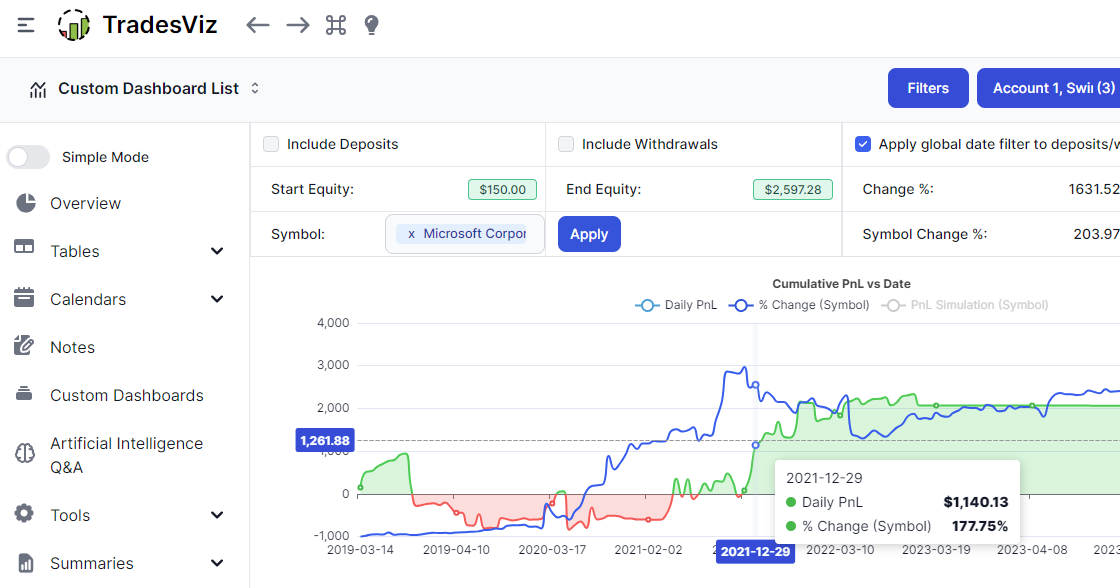
A perfect year-end feature! Compare your overall trading equity curve to ANY symbol - including indices, ETFs, etc., How did you fare against the market? This helps you understand and answer that question!
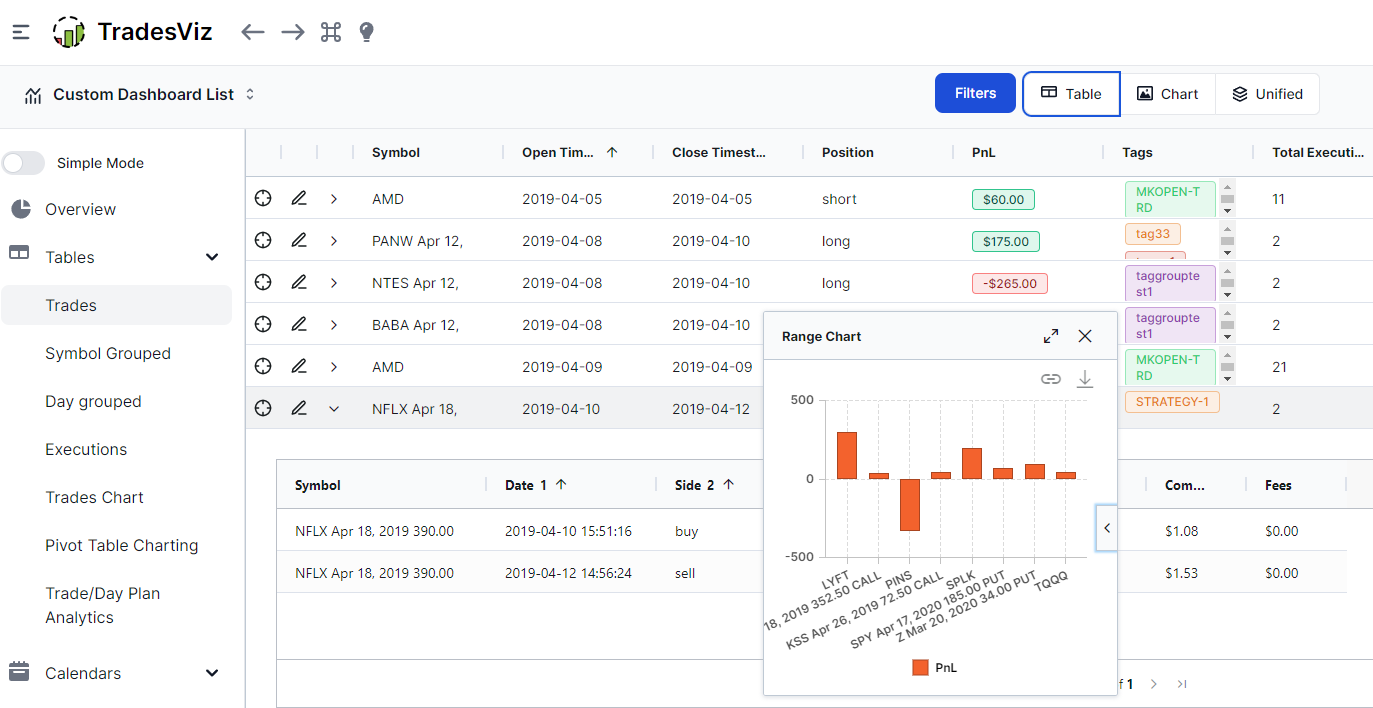
With the introduction of TradesViz v2.0, we have completely changed all the tables of the main dashboard to be based on advanced and flexible grids. Read on to learn more about the new features and just how much better this is compared to any other tabular journaling solutions out there.
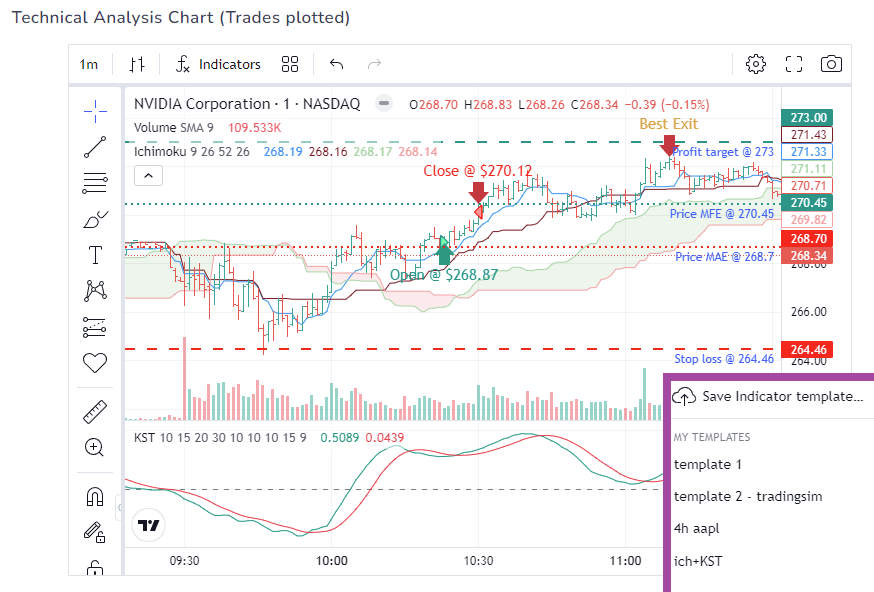
We've had super customizable image charts, then we introduced TradingView charts with customizable indicators and now you are able to automatically apply entire chart templates to your TradingView charts in TradesViz.
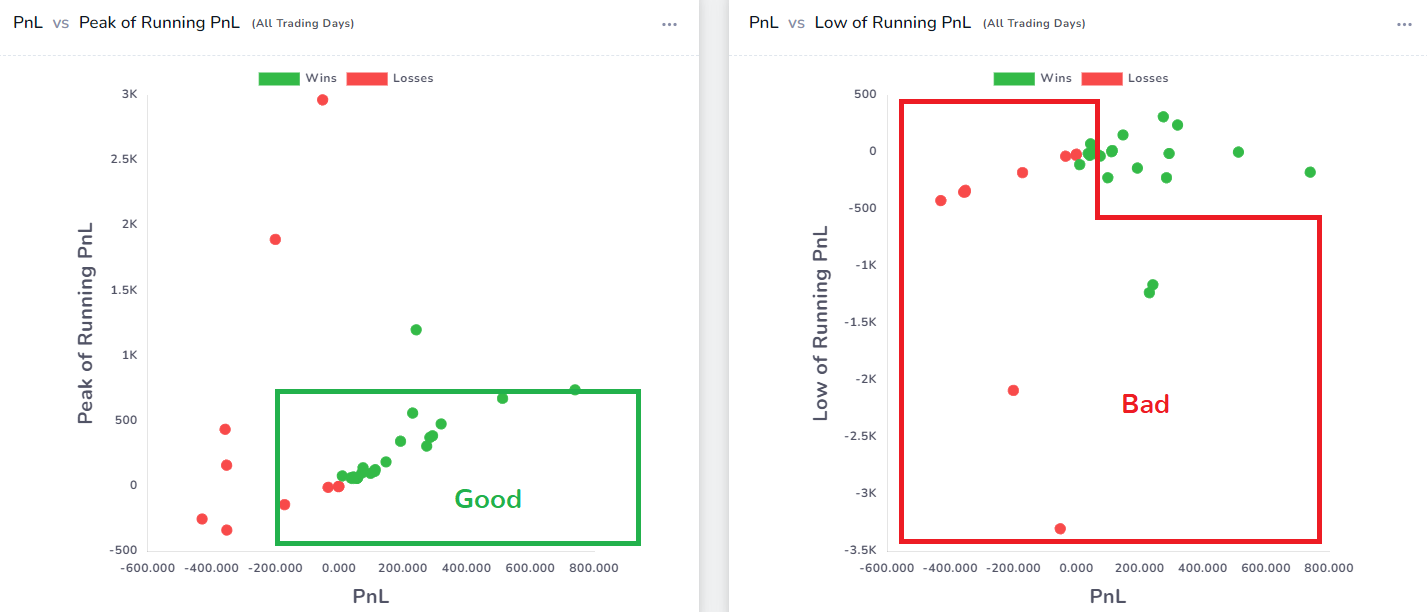
Are you a "lucky" bag holder? Do you find yourself holding on to winners too short or losers too long? You can now quantify and visualize these stats! Hard to accept for many traders, but it is easy to learn and improve yourself with these insights.
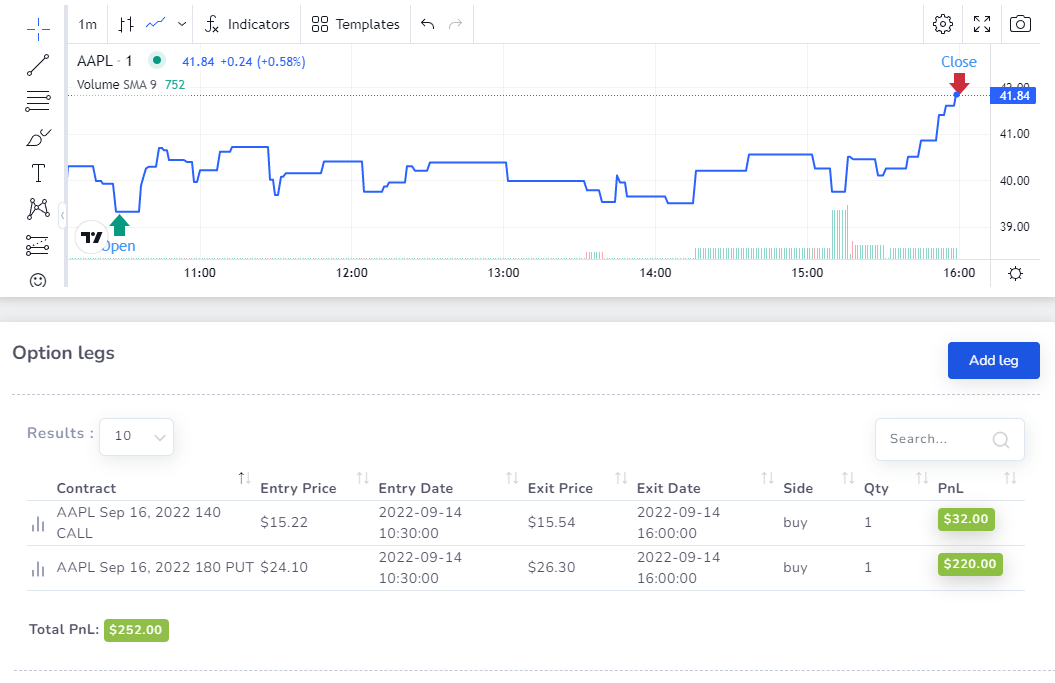
What if you had taken that spread during that day? What would have been the outcome? How do options prices/strategies move based on the underlying? Have you ever visualized a summed-up chart of your entire options spread? This feature will answer all the above questions and more + help you in understanding the options/underlying pricing correlation.
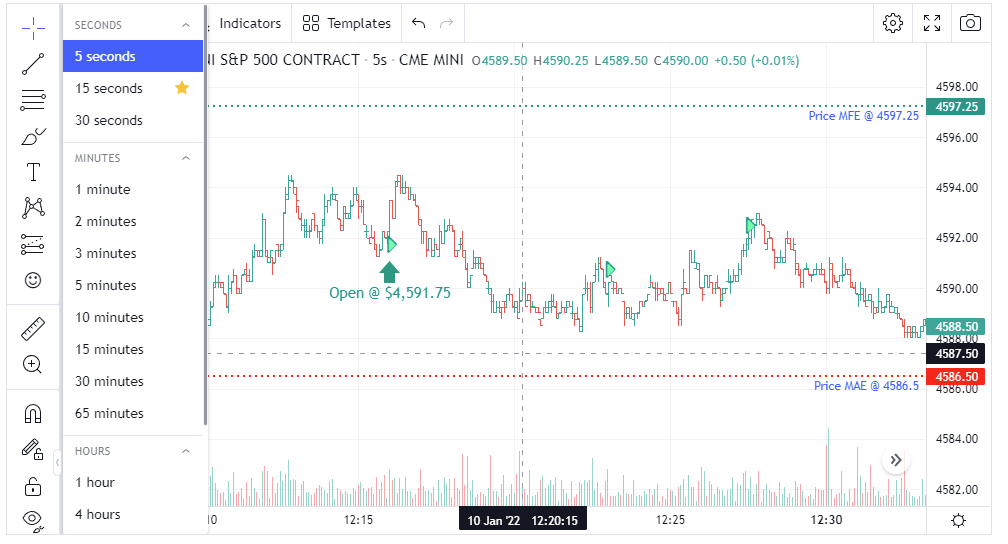
For the first time among any online trading journals, you can now view your US futures trades in as low as 5-second intervals.
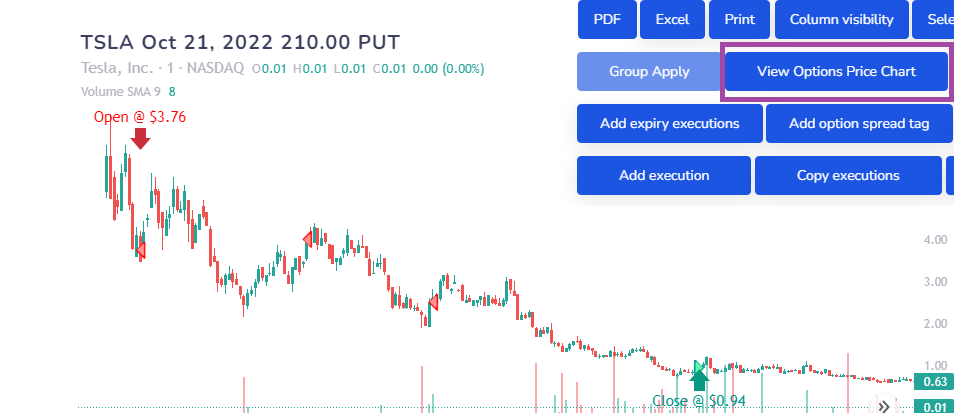
For the first time ever, you will be able to see your exact executions on an options price chart for ANY optionable symbol for any strike/expiry. Exclusive to TradesViz!
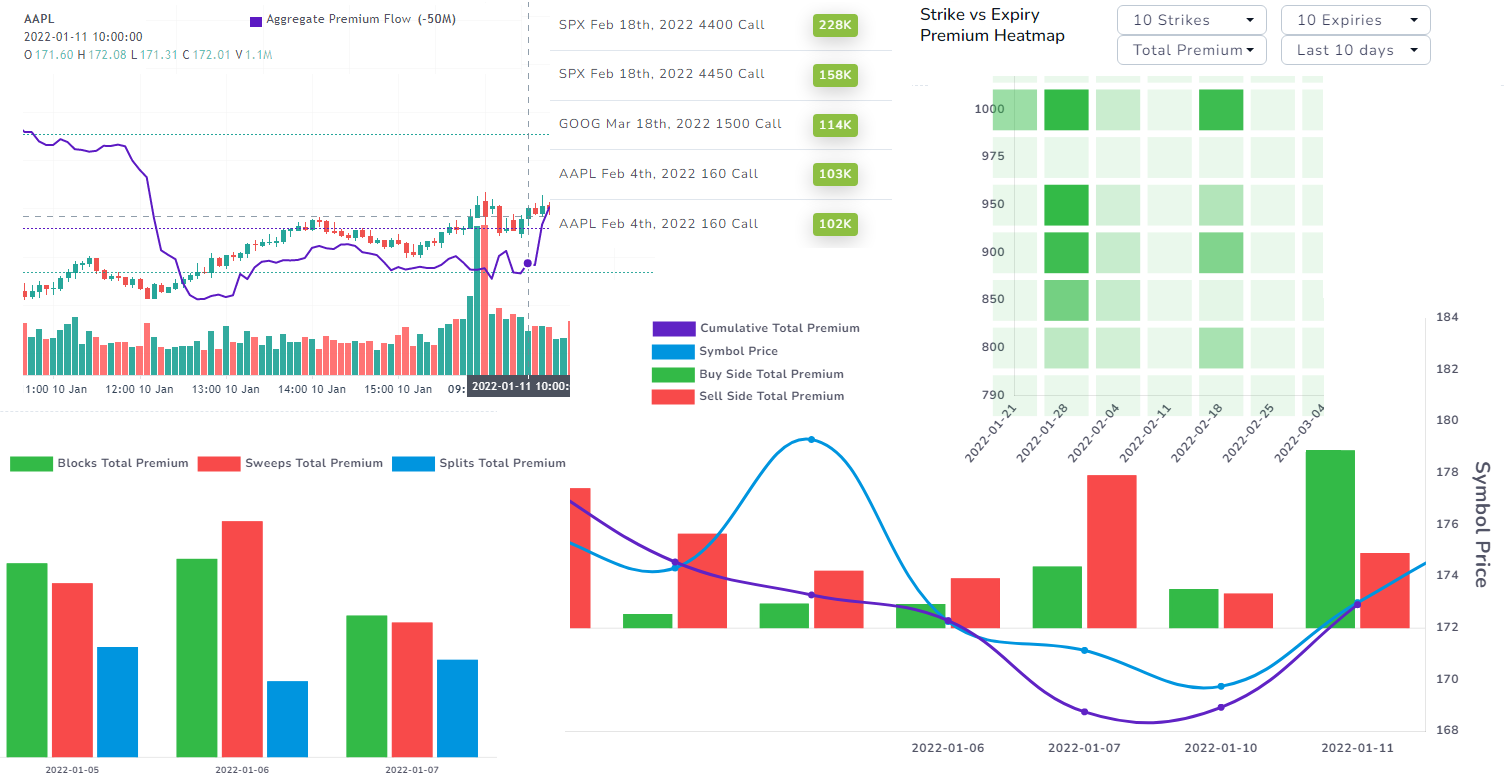
It's finally here: The best options flow dashboard with TRUE market data and all the right visualizations to help you plan your trades and learn more about the market conditions! Use flow analysis in combination with your journaling to get a COMPLETE picture of the market and how you performed.
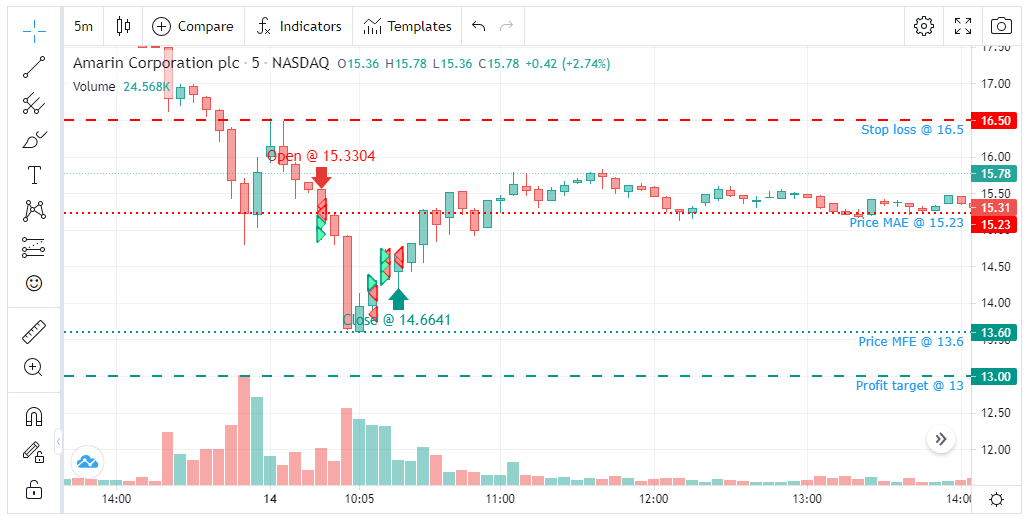
TradingView charts are now available for ALL your trades! 70+ Indicators, draw your technical analysis and save them on any chart, load and save custom indicator templates to use on any chart! Static charts, Custom interactive chats, and now we have the popular TradingView charts for your trades!