June 2020 Updates: More import platforms, Compare stats and more changes!
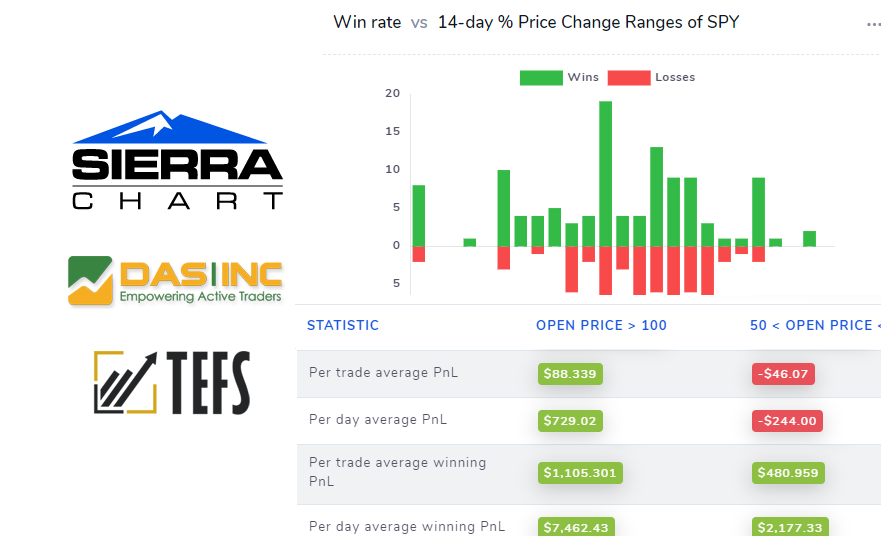
Details about changes and updates to TradesViz made this month! Changes include added support for more trading platform formats, new indicators to plot with, table to compare statistics of different trade groups.
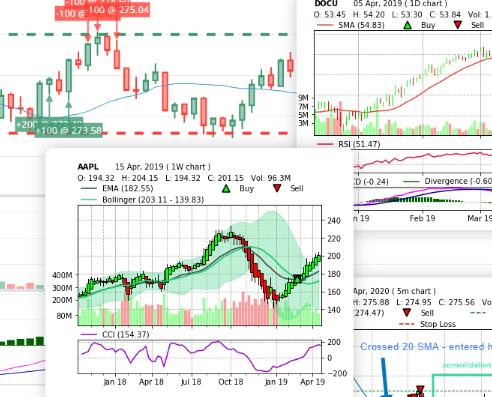
Generating stock/symbol charts
The most feature-filled symbol chart generator on an online trade logging platform out there! Learn how to add indicators, modify indicator parameters, draw on charts, even copy charts, and play around with a FULLY interactive bar-chart with indicators plotted!
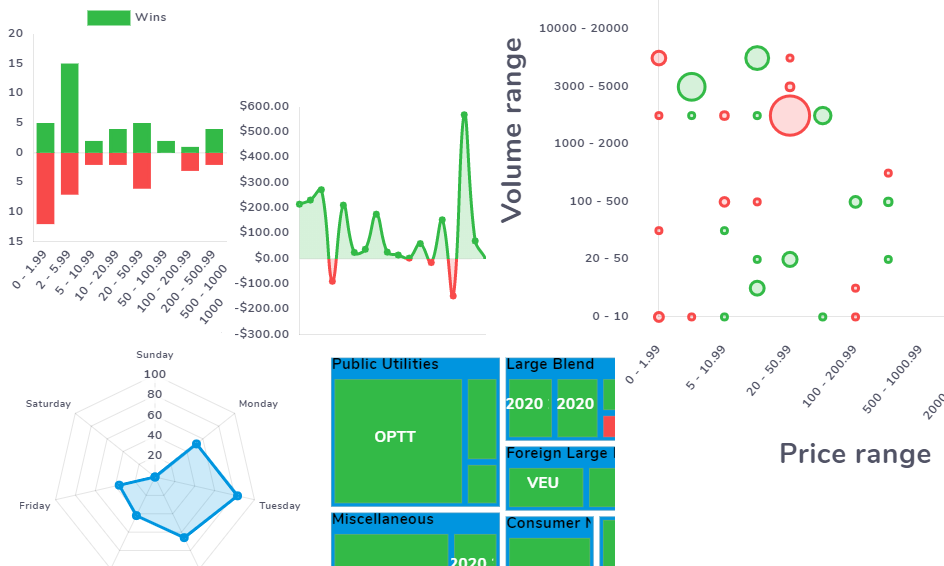
All about interactive charts
Charts dominate most of the tabs in TradesViz and they are the central element of interactivity. Learn how to navigate through the 70+ charts and also how to use features like click to explore and filter.
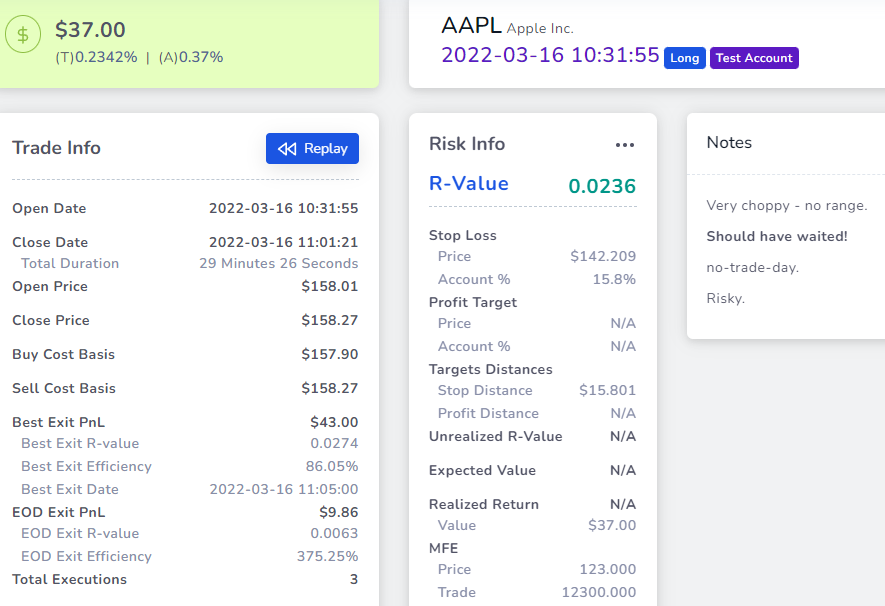
Tab: Explore Trade
One of the 3 main tabs of TradesViz. View everything - charts, executions, risk info, trade statistics about a trade in this tab. Learn how to customize and add tags, images, charts in this blog post.
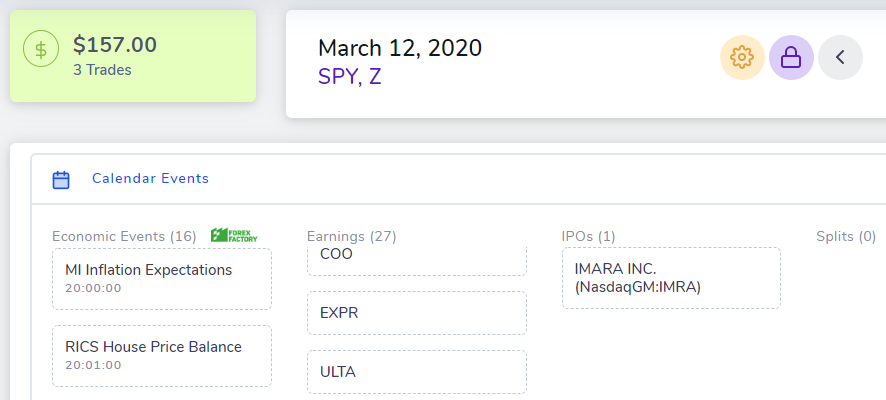
Tab: Explore Day
Get an overview of your full trading day with info about all market events such as earnings, IPOs, and also a list of global economic events happening on that day. Learn more about how you can even add charts, share your trading day, etc., in this post.