New Tabs: Tag groups analysis & Tag groups summary
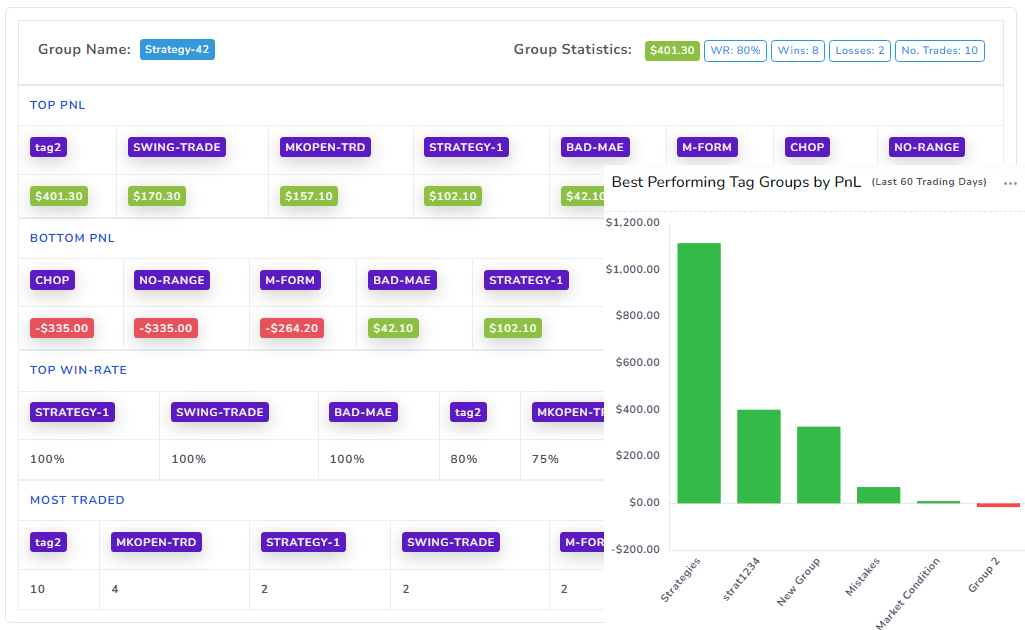
We wouldn't just stop at tag groups. With the introduction of tag groups, the first 2 new tabs are about visualizing your tag groups statistics and finding which tags within each tag groups you should focus on.
New features: Custom Tags & Tag Groups Statistics
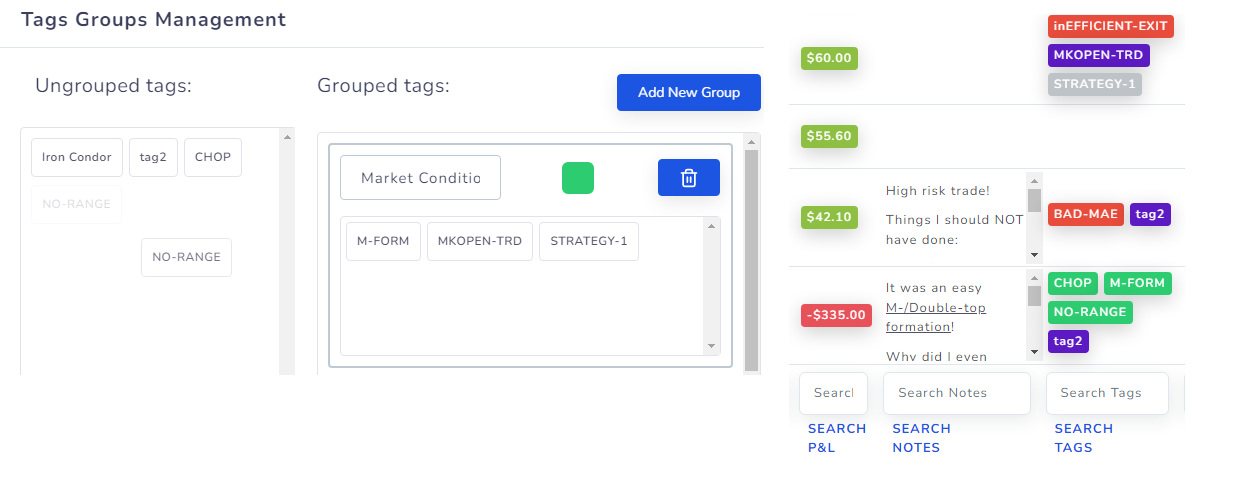
Still using "mistakes", "setups" as tag categories? We're here to change that. With the custom tag groups in TradesViz, you can now create ANY tag groups, assign any tags to each group and do analysis based on it!
New charts: Commission and fees statistics
Commissions are the new/small account killers. With these charts, you can exactly know where you are spending most of your account's value in commissions and fees and try to reduce it!
Update: Chart Trades View - Now with TradingView charts
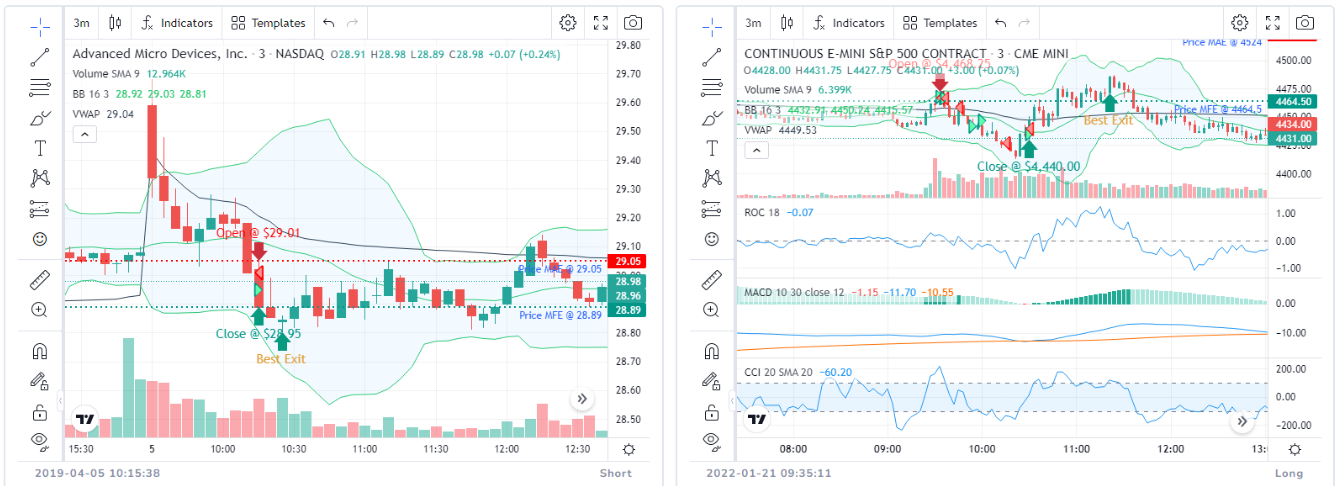
The popular charts view tab gets an upgrade: you can now switch between the static/image charts & TradingView charts!
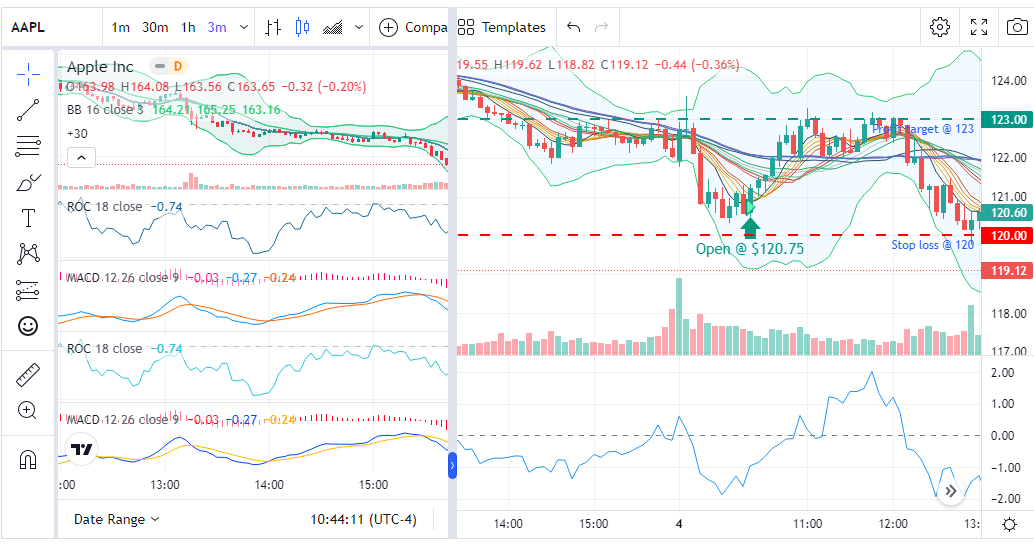
Create custom TradingView chart setups for all your trades!
Create a TradingView setup that will be auto-imported/applied to your technical analysis charts whenever you explore any trade.


