
New charts: Relative Volume Statistics
Do you trade well when there's a certain amount of volume/volatility? Time, date, time, etc., are not the only way to analyze. Learn more about how you can use the relative volume to optimize your trading.
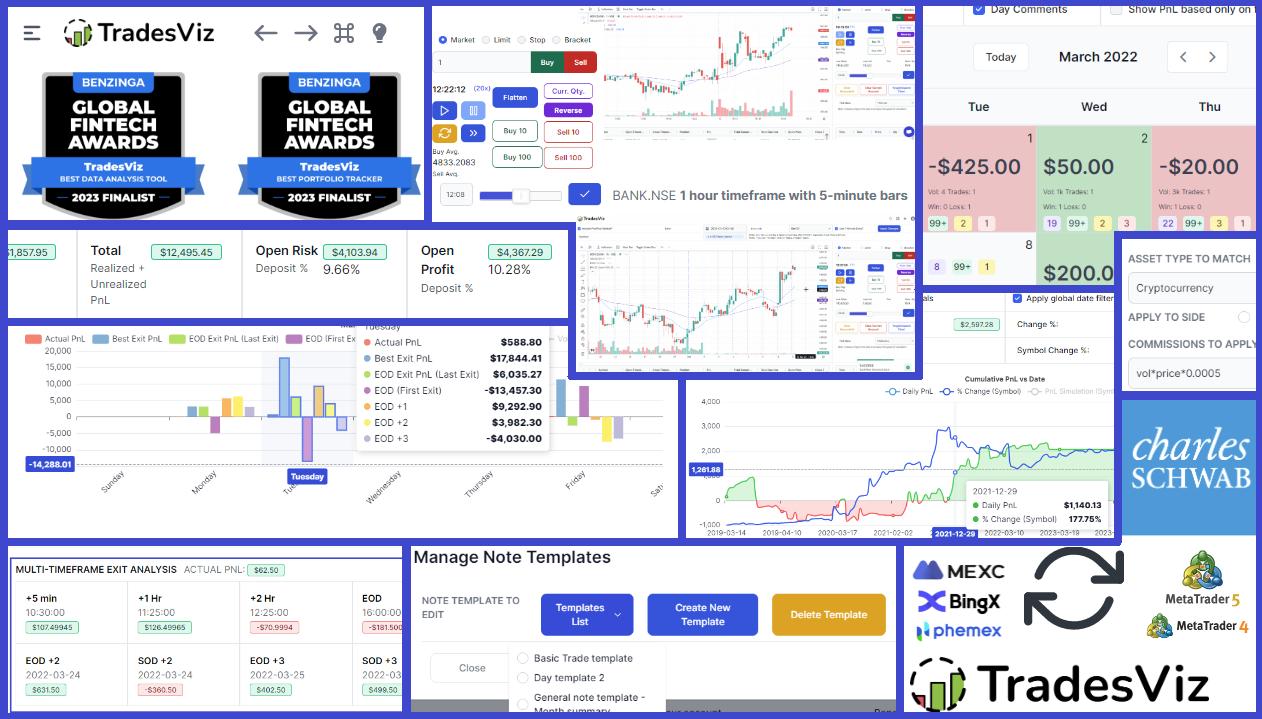
Sep 2023 to Apr 2024 Updates: TradesViz Trading Journal v2.0, Universal Simulator, 100% Auto-sync brokers, AI Features & Plenty of improvements!
TradesViz's biggest changelog to date! If you want to catch up on the biggest updates and improvements in the trading journaling and analytics world, this is it. Simulators, AI, v2.0 dashboard, Multi-timeframe exit, SO MUCH new features, and PLENTY of under-the-hood improvements!
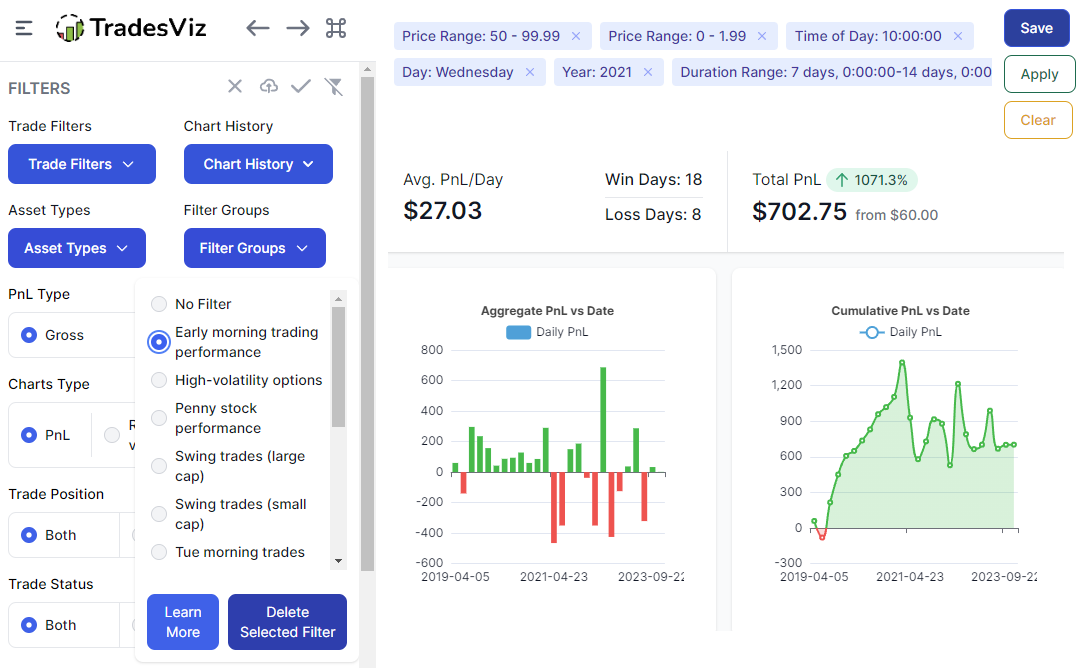
Building your own custom trading reports and save filters (TradesViz v2.0 update)
Build custom trade reports using charts and global filters. Save them and change your general dashboard to customized reports with specific filters! Combine this with custom dashboards and lock unlimited varieties of trading dashboard reports!
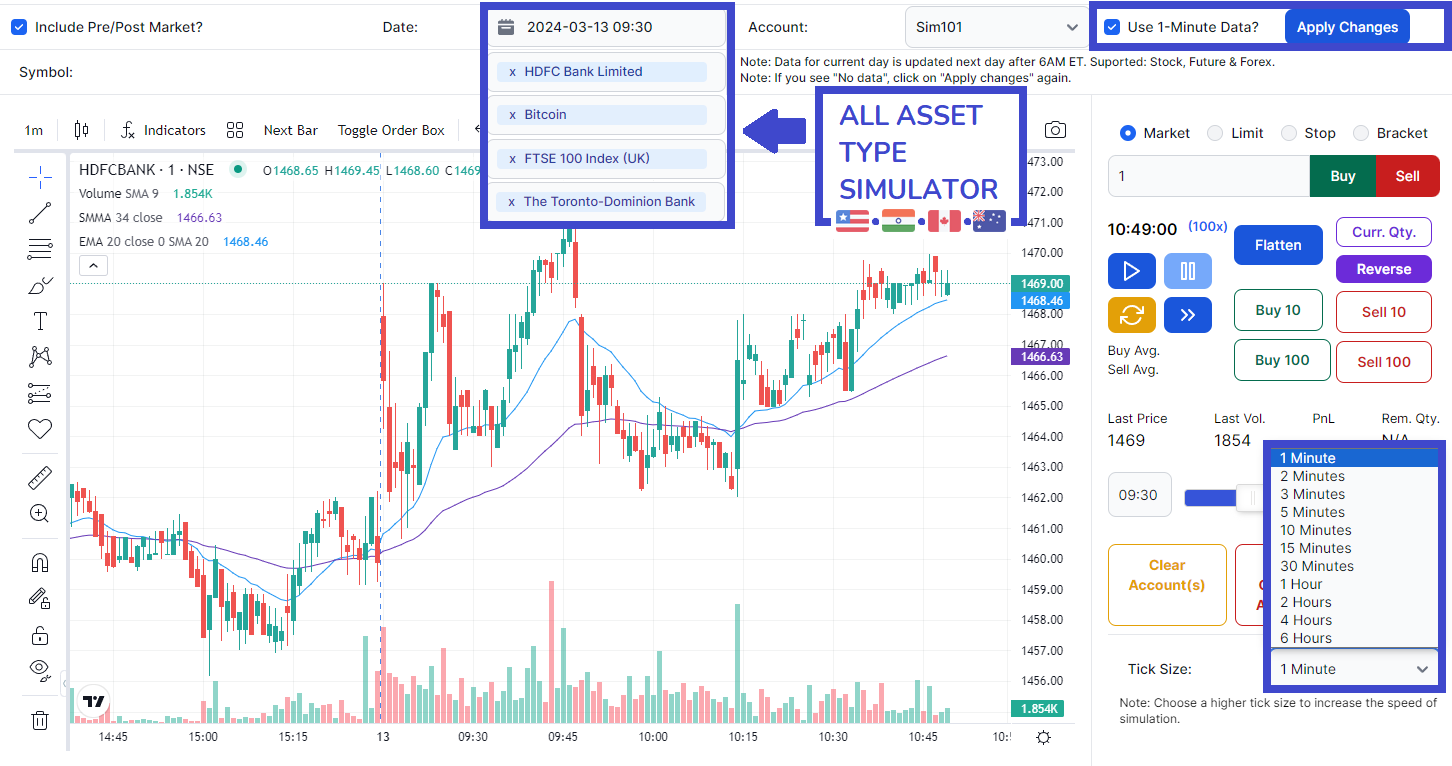
Universal Trading Simulator: Simulate and trade any symbol on TradesViz
We've introduced the most advanced and versatile online reading simulator for US stocks, ETFs, futures, and all forex pairs. But what about the other symbols and exchanges? Well, you can now. NSE/BSE, AU, IN, Cryptocurrency - everything can be simulated. All-in-one stock, futures, forex, cryptocurrency, and index trading simulator for all supported exchanges: Exclusive only on TradesViz.
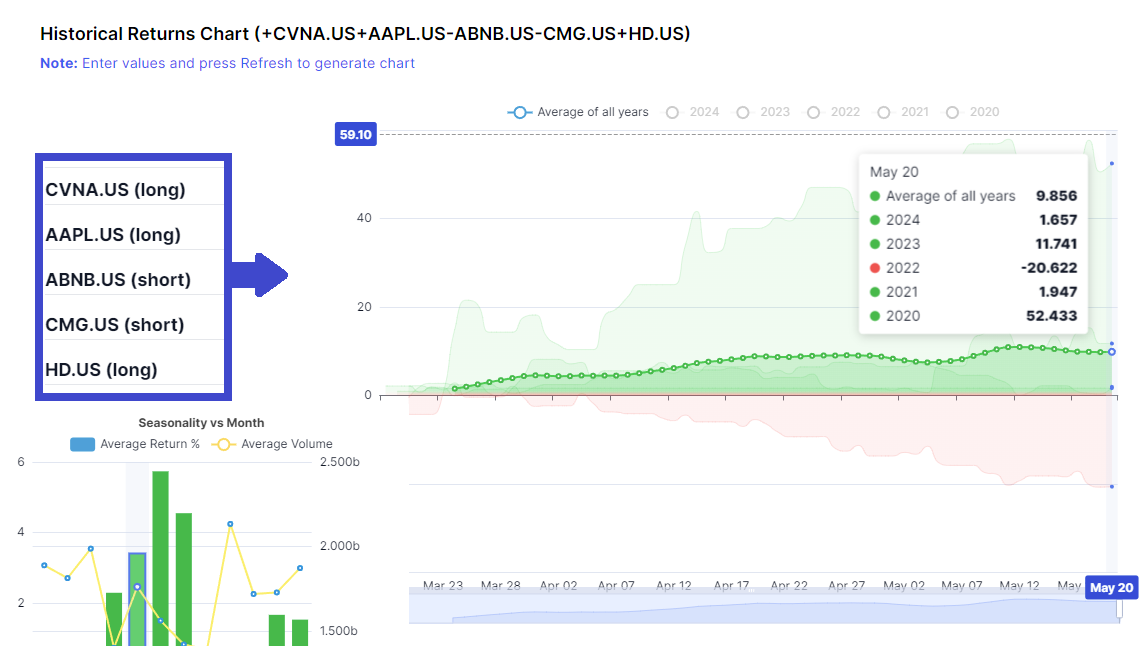
Seasonality Portfolios: How to build portfolios based on seasonality data on TradesViz
Seasonality data is a great way to understand the cycles of a stock over a period of time. But what if you could leverage this data to build portfolios of many tickers each balancing out the weaknesses of the other?... Read on to understand!