
Ever finished a trade and found yourself wondering, "What if I had set my stop-loss just a bit wider?" or "Could I have captured more profit with a different target?" These "what if" scenarios are crucial for refining your trading strategies, but exploring them has always been a challenge. Until now.
We're thrilled to introduce our powerful new Stop Loss/Profit Target Simulator! This feature lets you take your actual historical trades and replay them with different stop-loss (SL) and take-profit (TP) rules to see how things *might* have unfolded. It's like having a trading time machine for your exit strategies.
This has been a LONG-requested feature from MANY active users of TradesViz. We're happy to finally realize it to the public, and we're eager to hear your feedback on this feature! :) We've kept saying that many manually added attributes, like tags, targets, are important - it is because only using those extra pieces of information, you can reveal more data and insights about your trading. For stop loss and profit targets, you can 100% automate it using our advanced stop loss and profit target settings.
Need for Flexible Trade Simulation
Understanding the impact of your exit strategy is just as important as your entry. This simulator helps you:
- Test New Strategies: Experiment with different risk/reward parameters on past trades without risking live capital.
- Optimize Exits: Discover if you're leaving profits on the table or getting stopped out too early.
- Understand Risk Better: See how varying stop-loss levels might have changed a trade's outcome and its maximum adverse movement.
- Build Confidence: Gain deeper insights into how your chosen parameters perform across different market conditions that your trades have experienced.
Most traders struggle with stop placement. One way is to practice it via trading simulators, the other is via bulk simulation of many trades - which is exactly what this feature does.
Core Concept: Simulating "What If" Scenarios
The concept is very simple: We take trade(s) from your account (you have full control over what trades to simulate) and based on your inputs of how stop and profit should be handled, we simulate each execution thought the OHLC market data (put to 5-secs data for futures) - i.e bar by bar and find where the stop and profit occurs and show all of that to you per-trade along with MFE/MAE and more important stats.
Getting Started: Your Inputs to the Simulator
Interacting with the simulator is straightforward. You just need to define the list of trades that are to be fed into the simulator, along with the stop loss and profit target profiles.

1. Your Trade Data
So, how do you select the trading data? Well, there's no need to "select" anything. The simulator picks the `n` most recent trades from the currently filtered state of your dashboard.
For example, if you have filtered/selected a certain list of trading accounts, applied a few tag/price/pnl, etc., global filters, then from what remains of that data, we pick the `n` most recent trades. You define the `n`. So the way you "select" is by filtering. Use trading account filters, global date filters, and all the filters in the filters tab.
2. Defining Your Simulation Rules (The "What If" Parameters)
This is where you define the new stop-loss and take-profit conditions you want to test. There are 2 dropdowns at the top - one for stop loss type and the other for profit target type.
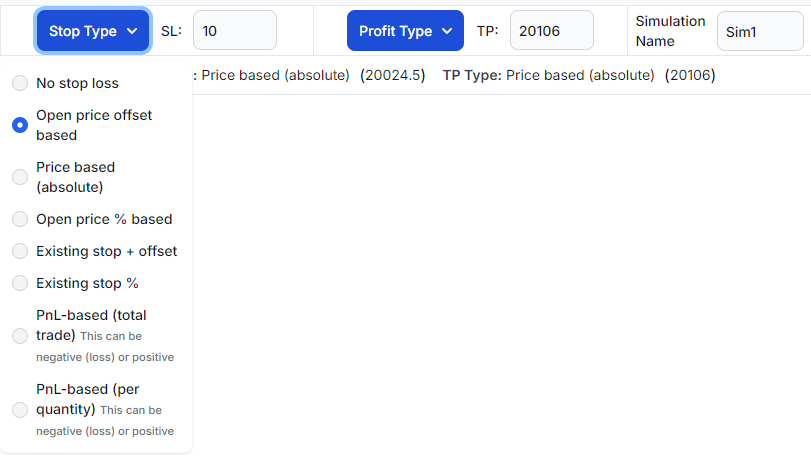
Finally, for each simulation, you can give it a name (e.g., "Sim TP1") and specify your desired stop-loss and take-profit rules from the available types. We'll discuss more about what each of the TP/SL options works below.
Deep Dive: Understanding Stop-Loss (SL) and Take-Profit (TP) Strategies
There are a total of 8 unique types of TP/SL profiles/configurations.
How it Works: Simply put, no stop-loss or profit-target is applied for the side you set to this option.
Your Input: Nothing. Just select no stop and/or no profit.
Example Scenario: The simulated trade will run until the end of the available price data for the simulation period, showing its maximum potential without predefined exits.
When to Use: To see the "pure" outcome of a trade's price movement or to establish a baseline before testing specific exit rules.
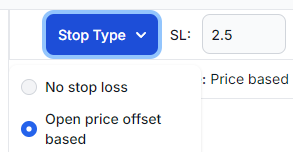
How it Works: Sets the target a fixed number of points or dollars away from your first opening execution price.
Your Input: Select `Open price offset based` and enter the offset value (e.g., "2.5" for 2.5 points/dollars) in the text box that appears near the dropdown.
Example Scenario (Short Trade, First Exec @ $200.00, SL Offset $2.50): The stop-loss price would be set at $200.00 + $2.50 = $202.50.
When to Use: Ideal for strategies that use a fixed risk or reward distance from the initial entry point.
How it Works: Sets the target at a specific, absolute price level you define.
Your Input: Select `Price based (absolute)` and enter the exact price level (e.g., "198.00").
Example Scenario: You set a profit target at $210.50, regardless of your entry price.
When to Use: When targeting known support/resistance levels, pivot points, or other significant price areas.
How it Works: Sets the target as a percentage of your first opening execution price.
Your Input: Select `Open price % based` and enter the percentage as a decimal (e.g., "0.01" for 1%, "0.005" for 0.5%).
Example Scenario (Long Trade, First Exec @ $100.00, SL 1%): Stop-loss price = $100.00 * (1 - 0.01) = $99.00.
When to Use: Good for strategies where you want your SL/TP distance to scale proportionally with the instrument's price at entry.
This is where things get interesting. The simulator can not only handle NEW inputs, but you can also simulate what would have happened if you had deviated by a certain amount from your already existing/executed trade's TP/SL.
How it Works: This rule looks at the stop-loss or profit-target (if any) that was defined for your *original historical trade*. It then applies the offset you specify to this existing target.
Your Input: Select `Existing stop + offset` and enter the offset amount. Note: You need to make sure your trades have TP and/or SL if you are using this option.
Example Scenario (Short Trade, Original SL was a price at $20100.00, you input a value of "5.0" to widen it): The new simulated SL price would be $20100.00 + $5.00 = $20105.00.
When to Use: Perfect for testing "what if my original stop was just X points/dollars further/closer?" without redefining the whole target logic.
Important: If your original trade didn't have a defined SL or TP for the relevant side, this rule type will not set a new target, as there's no "existing" target to modify.
How it Works: Similar to "Existing Offset," this uses your original trade's logged SL/TP as a base. It then adjusts this base by the percentage you specify.
Your Input: Select `Existing stop %` and enter the percentage change as a decimal (e.g., "0.1" for a 10% wider target, "-0.05" for a 5% tighter target).
Example Scenario (Long Trade, Original SL implied a -$2.00/share PnL from your first execution price. You input value: "0.1"` to increase the allowed loss by 10%): The new simulated SL would correspond to a PnL of -$2.00 * (1 + 0.1) = -$2.20/share (which is then converted to a price level).
When to Use: Useful for testing proportional adjustments to already defined targets from your past trades.
Important: If your original trade didn't have a defined SL or TP, this rule will not set a new target.
How it Works: Exits the trade when its current running Profit or Loss (in your account currency) reaches the absolute value you specify.
Your Input: Select `PnL-based (total trade)` and enter the total currency PnL threshold (e.g., "-200" for a $200 stop-loss, "400" for a $400 profit target).
Example Scenario: You set a stop-loss at -$200. If the simulated trade's TOTAL PnL at any point drops to or below -$200, it exits.
When to Use: For managing trades based on a fixed dollar risk or reward per trade, regardless of price levels or percentages.
How it Works: Sets a target based on the currency PnL achieved per unit of quantity (per share, per contract).
Your Input: Select `PnL-based (per quantity)` and enter the currency PnL per unit (e.g., "-2.50" for a $2.50 loss per share/contract, "5.00" for a $5.00 profit per share/contract).
Example Scenario (Short Trade, Target +$10 PnL/contract): If you're short 5 contracts, this translates to a $50 total PnL. The simulator converts this PnL/quantity target into an equivalent price level based on your first execution price and the instrument's characteristics (like point value for futures, which our platform handles).
When to Use: When you think in terms of risk/reward per share or contract, especially if normalizing across different instruments.
Understanding Your Simulation Results: Key Output Metrics
After a simulation runs, you'll get a wealth of information to analyze:

At the top, you will see 2 sections - on the left are the stats from the original trades, and on the right are the stats from the simulated trades (using the SP/SL profile you created). The stats are mostly self-explanatory, and if you need help with the definitions, please refer to the blog posts below:
- MFE/MAE: https://www.tradesviz.com/blog/mfe-mae-charts/
- Related Advanced stats: https://www.tradesviz.com/blog/advanced-stats/
Below the stats, you will see a chart with cumulative pnl (sorted by date) and the individual trade pnl for each of the original and simulated trade sets. Finally, you will also see a grid/table below that shows stats side by side - the original and the simulated on (prefixed with "(S)"). Thi s is a full fledged grid that has all charting, filtering, sorting, exporting and saving capabilities of other grids on TradesViz.

- Calculated SL/TP: The actual price levels or PnL thresholds used for the simulation based on your rule.
- Exit reason: This could be due to stop_loss hit or profit_target hit or if the data was not available and the simulation was stopped due to it.
- Simulated PnL: The final profit or loss of the simulated trade, in your account currency.
- Trade MFE: The Maximum Favorable Excursion in currency. This is the most profit the simulated trade was in (unrealized) before it closed.
- Trade MAE: The Maximum Adverse Excursion in currency. This is the most loss the simulated trade was in (unrealized) before it closed.
- Price MFE: The largest favorable price move (in points/dollars) from your **first opening execution price**.
- Price MAE: The largest adverse price move (in points/dollars) from your **first opening execution price**.
Limitations:
- Only stock, futures, forex, and cryptocurrency are supported (i.e, no derivatives/options are supported at the moment)
- You can only run one simulation at once with a max. of 50 trades (limits will be increased as we get more info on usage)
Example: Simulating an MNQ Trade
Let's imagine you had a long trade in MNQ (Micro E-mini Nasdaq 100 futures). Your entries were all at $20,084.00 for 5 contracts and exited at $20,100.00 for a total profit of $160 for 10 contracts traded (5 buy, 5 sell). Here's what the trade looks like on the trade explore page:

Stop for this trade is at 20013 (71 points), and profit is at 20100 (16 points).
First, to understand and make sure that the simulator works with the given constraints, we are going to simulate this trade with exactly the same stop and profit parameters:

We are seeing identical stats, not that there may be some difference due to exit, because the simulated exit is based on the close price of the underlying OHLC bars used. You can also see the running P&L graph in the table itself. This confirms that the simulator gives the same result as if the trade were executed originally, if the same stop/profit parameters are used to simulate it.

Let's simulate with the Stop loss as 20040 with Price-based (absolute) configuration.

Ouch...
Ok, what if we widen the stop and profit by 10%?
Here are going to use "Existing stop %" for both TP and SL with 10 as value.

Not bad!
The exit was at 12:37, and based on the chart below, you can see why the profit almost 10x'd...

This is just an example of 1 trade to keep things simple. You can do this for dozens of trades at a time.
The possibilities of risk management simulation are limitless here. We're just getting started with these types of simulation features, which are proving to be most useful for traders. Interactive and experiment-based learning sticks longer, and you will remember it next time you execute a trade :)
Limitations to Keep in Mind
- Not a Crystal Ball: Simulations are based on historical data and cannot predict future market movements.
- Slippage: The simulation assumes your stop-loss or profit-target orders would have been filled exactly at the specified price. Real-world slippage is not modeled.
- Commissions & Fees: The primary PnL calculation focuses on gross price movement. While your final reported PnL *after* simulation might be adjusted by your platform's PnL function (which can include these), the simulation's exit-triggering logic itself does not model these costs. Original trade commissions are carried through for comparison.
- Order Types: Assumes market-like execution at the SL/PT levels. It doesn't simulate complex order management or partial fills for the *simulated exit* (the entry, however, uses your actual historical fills).
Conclusion: Empowering Your Trading Analysis
Our new Trade Exit Simulator is a powerful addition to your analytical toolkit. Rigorously testing different exit parameters on your past trades helps you gain deeper insights, understand risk better, and systematically refine your strategies. We believe this tool will empower you to make more data-driven decisions in your future trading. Along with our trading simulator, backtester, options flow, options payoff chart, daily stock screeners, seasonality/fundamentals, this will be yet another tool that's available to TradesViz users. No other platform in the world has nearly the level of advanced, useful features like TradesViz.
We see TradesViz as an end-game trading anlaysis and simulation platform for traders who are serious about improving in trading. With more additions coming soon, powered *usefully* by AI, we hope to continue pushing the boundaries of trade journaling with your support!
Explore the Trade Exit Simulator, experiment with different rules, and see what new perspectives you can gain on your trading. As always, we welcome your feedback and suggestions as we continue to enhance our platform.